Cache hit rate and workload balance are the foundations of high-throughput agentic inference.
TokenSpeed serves Kimi K3 NVFP4 at 331.18 output tokens/s per GPU on the full AgentX trace—1.92× the output throughput per GPU of our standard eight-GPU DCP8 serving baseline. The DWDP16 + DEP16 result uses 32 NVIDIA GB300 GPUs, with throughput normalized across all prefill and decode GPUs. The design combines independent prefill execution, efficient batched decode, and a shared cache that retains agent histories between turns.
Prefill and decode use different parallelism strategies because they face different costs. Shared caching frees prefill placement from conversation affinity, while asynchronous scheduling keeps preparation and transfers from interrupting useful GPU work.
Model architecture
Kimi K3 is a multimodal mixture-of-experts (MoE) model with 2.8 trillion total parameters and 104 billion activated parameters. Its 93 layers include 69 Kimi Delta Attention (KDA) layers and 24 gated Multi-head Latent Attention (MLA) layers. Its routed MoE selects 16 of 896 experts per token and also includes two shared experts. Attention Residuals combine information across layers.
Kimi K3’s extreme model size makes GPU memory capacity a central serving constraint. Even with low-precision weights distributed across GPUs, model weights occupy a substantial share of HBM. Activations and execution workspaces further reduce the space available for MLA KV history and KDA state checkpoints. This limited cache capacity is a major source of cache pressure, especially when many long-running agent sessions need their histories retained between turns.
MLA attention cost grows with retained history. KDA maintains recurrent state, so reusing a prefix requires a compatible state checkpoint as well as the corresponding MLA history. These different cache requirements shape both memory management and execution.
AgentX workload
We evaluate the complete serving system with the text-input AgentX workload, which includes long conversation histories, bursts of subagent requests, and inter-turn delays. Long histories increase the cache needed per conversation, while subagent bursts increase the number of contexts that must be held concurrently. Both add pressure to the limited cache capacity left after loading the model.
Inter-turn delays add retention pressure without contributing inference work. A session waiting for tools or its next turn leaves compute idle, but its history must remain cached to avoid recomputation when it resumes. Keeping the GPUs busy therefore requires enough concurrent sessions to cover these idle periods, increasing the amount of history the system must retain. Client concurrency counts active sessions; it does not equal the number of requests executing on the GPUs.
System overview
The deployment has three principal components. Prefill uses Distributed Weight Data Parallelism (DWDP) across 16 GPUs, with each rank executing independently. Decode combines attention data parallelism and MoE expert parallelism across another 16 GPUs, which we call DEP16. A shared host-memory L2 pool makes retained history available to every prefill rank.
Shepherd Model Gateway (SMG) serves as the request router, selecting the prefill and decode ranks independently for each request. Prefill reads and publishes reusable history and state checkpoints through shared L2. After prefill completes and decode has allocated its destination cache, KV and state transfer to the decode rank, which generates and streams the output.
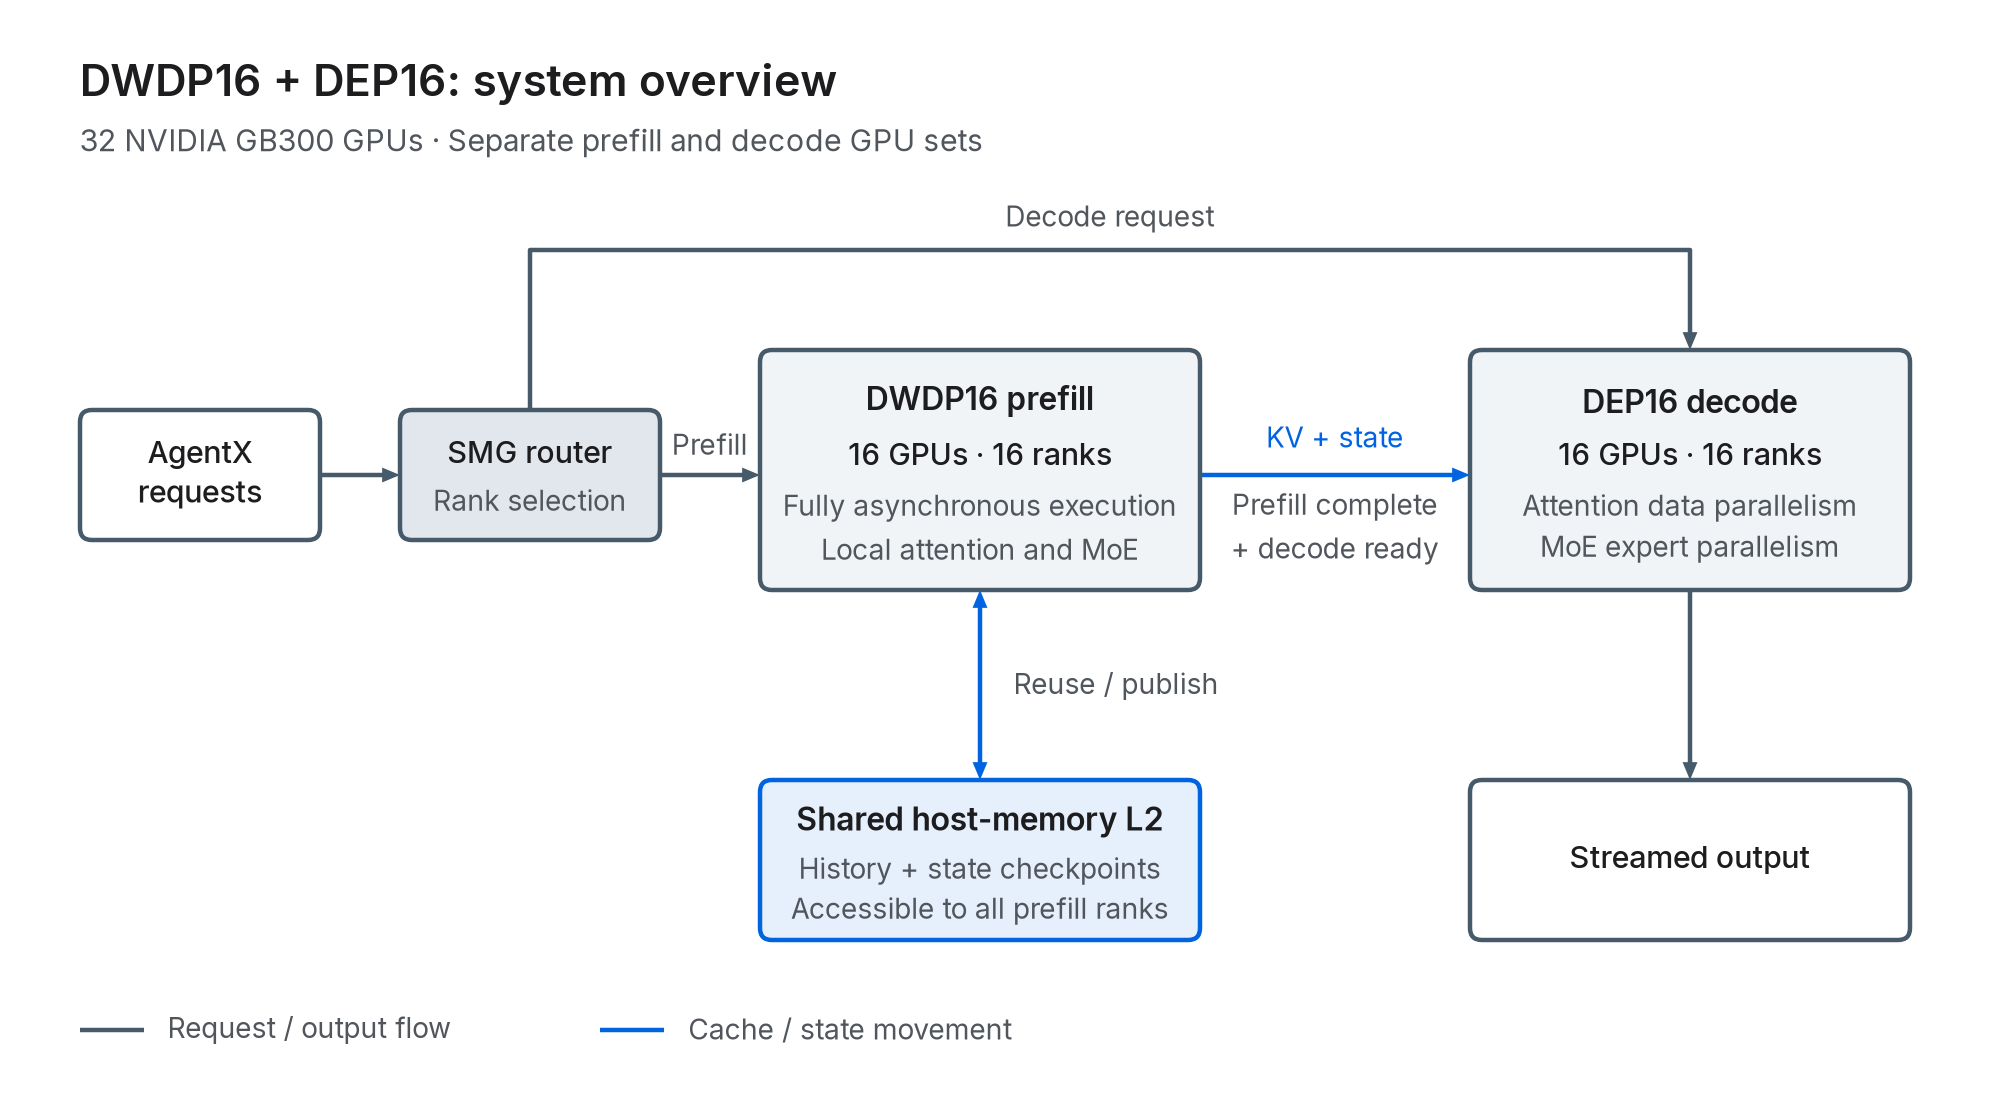
Figure 1. Prefill and decode use separate GPU sets. The shared L2 pool serves all prefill ranks; the router selects prefill and decode destinations independently.
DEP decode: efficient batched execution
DEP: Keep attention local and distribute the experts
DEP keeps each request’s core attention local and distributes routed experts across GPUs. MoE dispatch sends tokens to the selected expert owners; combine merges their contributions and returns the results to each token’s attention rank.
The main advantage is communication scaling. Compare DEP with a tensor/expert-parallel (TEP) baseline. Let
In a simplified model with equal payload width and precision, consider the common two-all-reduce TEP pattern. Each communicates approximately
DEP uses dispatch and combine. A token selecting
and is strictly smaller when deduplication or local execution removes transfers. At fixed per-GPU token load, this bound depends on topK rather than EP size. TEP’s all-reduce volume grows linearly with
Figure 2 measures the collective costs for Kimi K3. Its latent MoE adds a third reduction: the TEP comparison uses two BF16 all-reduces at width 7168 and one at width 3584, each over the global batch of
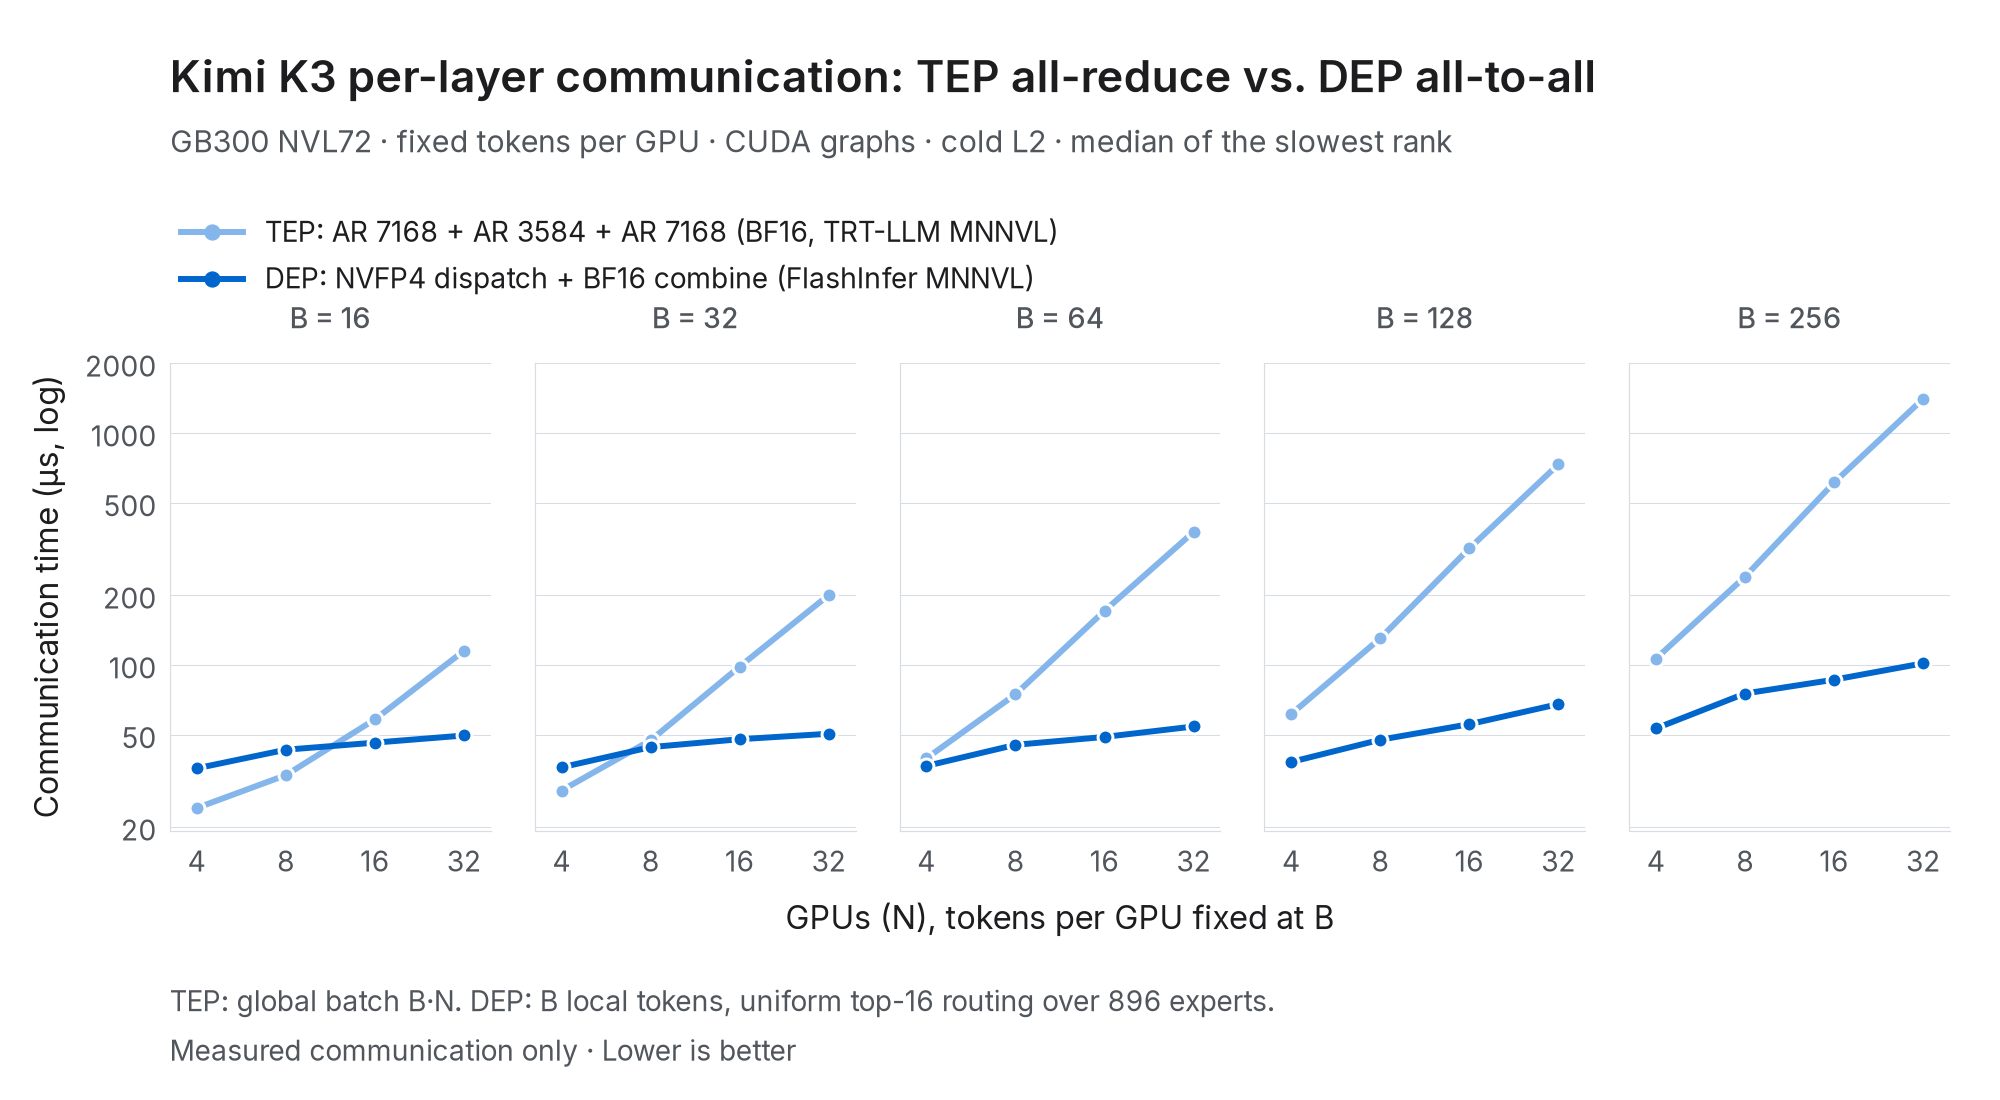
Figure 2. Measured per-layer communication time on GB300 NVL72, assembled from isolated collective timings. Each chart fixes the local token count
TEP is faster at the smallest workloads, while DEP’s advantage grows with both token count and GPU count. At 32 GPUs and 256 local tokens per GPU, DEP has 13.8× lower communication time in this comparison. The different transport precisions are part of the measured configurations.
Two additional benefits support choosing DEP:
- Larger compute shapes. Local attention retains the full set of heads, avoiding increasingly narrow tensor-parallel partitions of the attention work.
- Less duplicated computation. Replicated operations such as RMSNorm and AttnRes process
tokens on every TEP rank. DEP applies them to each rank’s local tokens.
The drawback is imbalance. Ranks receive different request counts and history lengths, and experts receive uneven token loads. MoE communication still couples the ranks, so a rank with more attention or expert work can make the others wait. Wider EP can improve MoE efficiency while increasing exposure to these stragglers. EP16 is the practical configuration used for our results; the useful width depends on this balance.
Use TP4 selectively for projections and shared experts
DEP distributes routed experts, but attention projections and shared experts still occupy substantial memory when their dense weights are replicated on every GPU. That leaves less space for KV cache and recurrent state. We shard selected KDA/MLA input and output projections and shared experts within small TP subgroups to reduce replicated weight memory and improve weight reuse while keeping communication within the subgroup.
With TP4, each GPU stores approximately one quarter of the selected weights. For balanced local batches of
The added collectives involve only four GPUs, independent of the overall EP size. Each operation returns complete outputs to the original token owner, so core attention and its cache remain local. This preserves DEP's execution model while addressing its replicated-weight cost.
Consider a linear projection with input and output dimensions both equal to
| TP subgroup | Weight memory/GPU | Saved memory/GPU | AG + A2A sent/GPU/layer/local token |
|---|---|---|---|
| TP1 | |||
| TP2 | |||
| TP4 | |||
| TP8 | |||
| TP16 |
All quantities are in bytes, with memory savings relative to replicated execution. For subgroup size
TP4 is a sweet spot for this memory–communication tradeoff: it eliminates 75% of replicated weight memory. TP8 saves another 12.5% of the original weight memory, but requires 2.1× the communication in this square-projection example. Larger groups offer progressively smaller additional memory savings at higher communication cost.
The following memory budget is for Kimi K3 NVFP4 served with DEP16. Its GEMM weights use NVFP4 for routed experts, FP8 for attention projections, and BF16 for shared experts. Each request with 200k context tokens, FP8 target/drafter KV cache, and two BF16 KDA checkpoints needs approximately 3.35 GB of cache.
| Per-GPU budget | Without TP4 | With TP4 |
|---|---|---|
| GPU memory | 298.01 GB | 298.01 GB |
| Kimi K3 NVFP4 text-model weights | 173.06 GB | 128.53 GB |
| EAGLE3 weights | 6.03 GB | 6.03 GB |
| Activations, graphs and workspace (assumed) | 40 GB | 40 GB |
| Remaining for KV and KDA cache | 78.92 GB | 123.45 GB |
| Estimated 200k-token requests | 23 | 36 |
The 44.53 GB of weight savings per GPU translates to about 56% more cache capacity under this budget. To examine the execution benefit alongside these memory savings, Figure 3 compares the KDA QKV/gate projection with replicated weights and TP4.
To reduce exposed communication overhead, we fuse AllGather, activation quantization, the sharded GEMM, and All-to-All into a single kernel for the QKV/gate projection. The kernel pipelines data transfers with matrix multiplication, allowing communication and computation to overlap. In this comparison, the fused path is used at 64 or more local tokens; smaller batches use separate kernels.
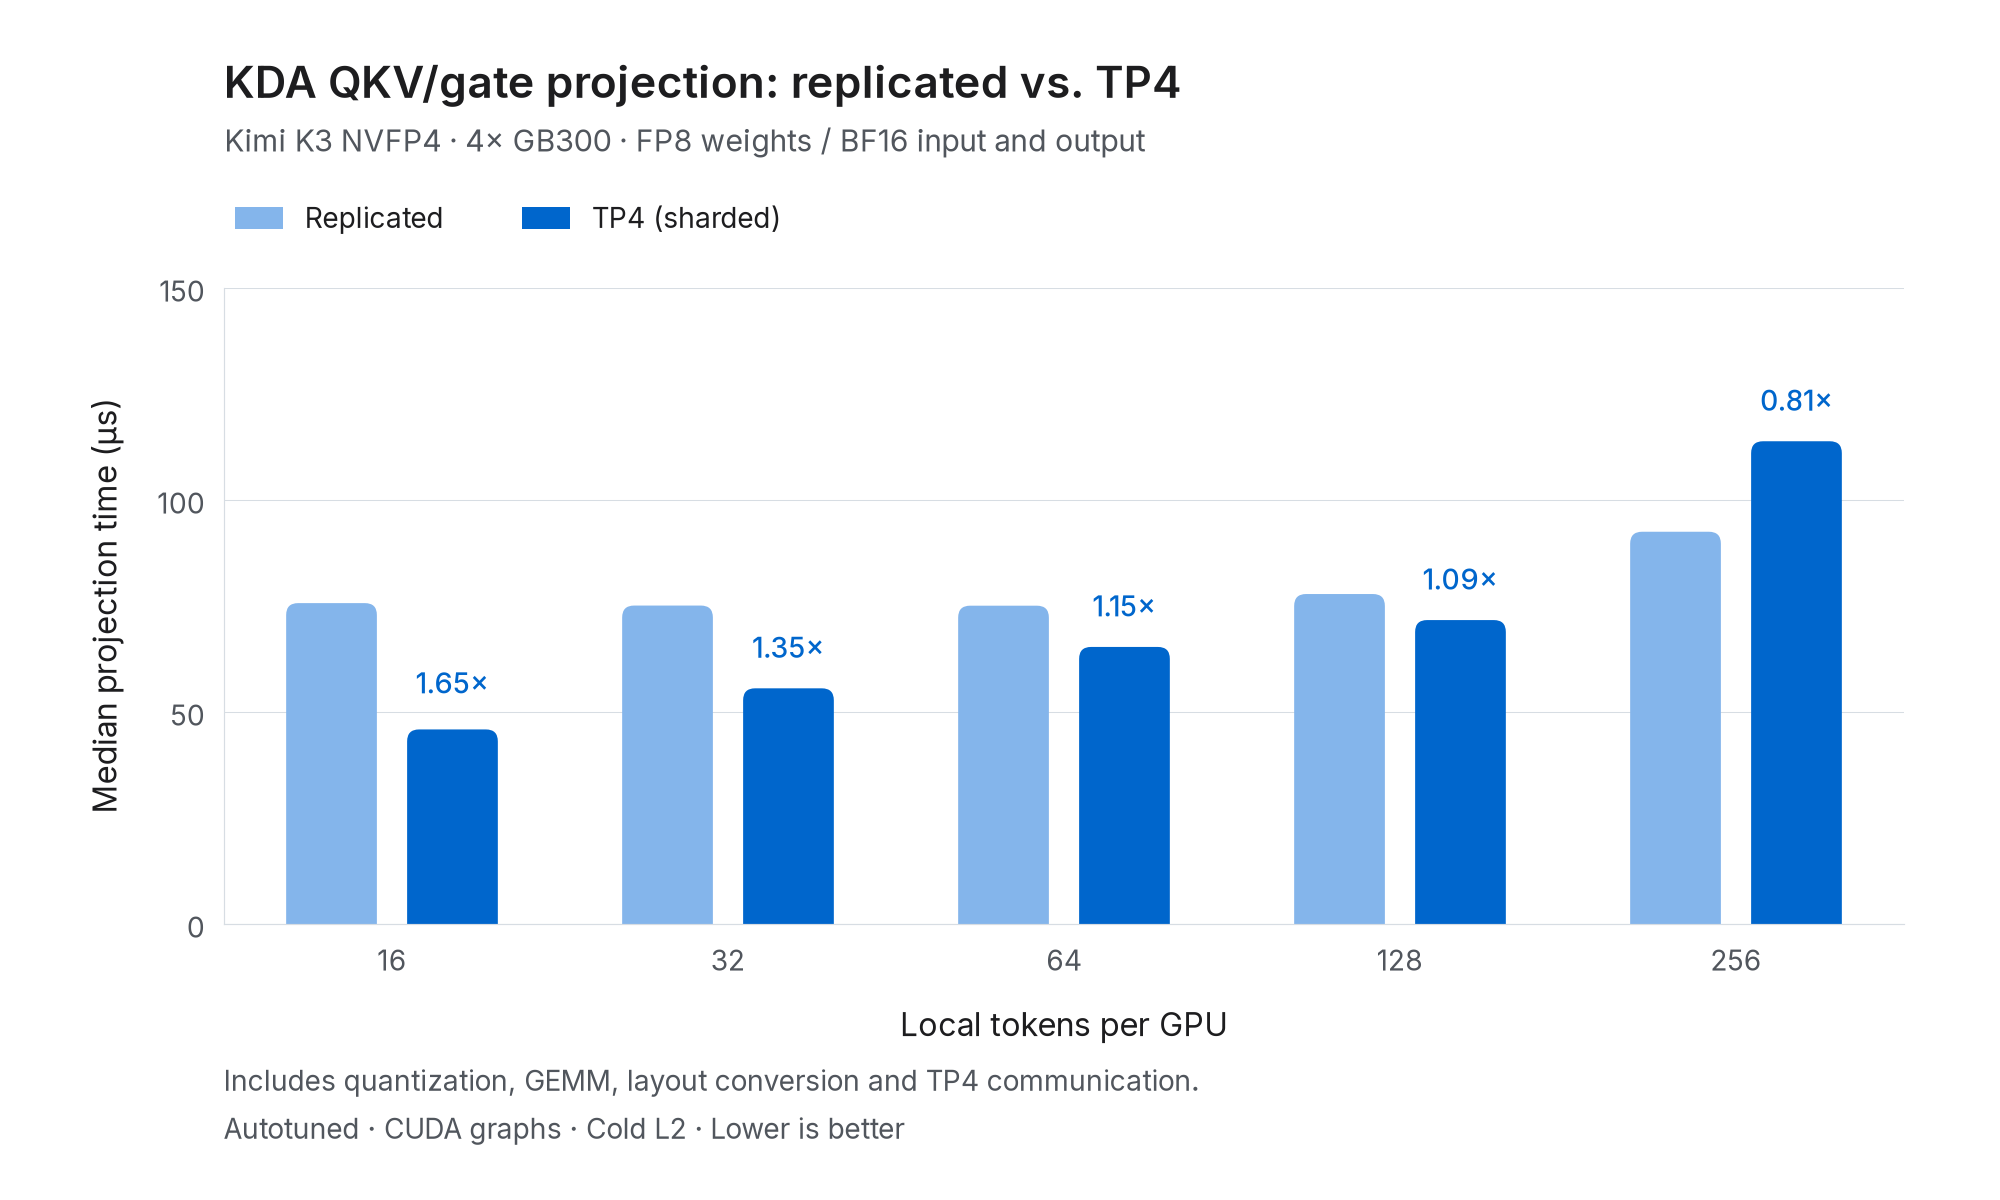
Figure 3. Median KDA QKV/gate projection latency, including quantization and TP4 communication, at equal global token counts on four GB300 GPUs. Labels show speedup over replicated execution; values below 1× indicate a slowdown.
The figure shows faster execution with TP4 at 16–128 local tokens. At small token counts, the projection is limited by memory bandwidth: sharding reduces the weight data each GPU loads from HBM and reuses each shard across more tokens. TP4 therefore improves forward execution efficiency while freeing memory for more requests.
With 200k context tokens per request, the budget above supports roughly 36 requests per rank. Our EAGLE3 configuration verifies four tokens per request, corresponding to about 144 local tokens per forward. The slowdown at 256 tokens thus falls beyond the expected decode batch range for this long-context configuration.
Balance MLA work with per-request KV splitting
AgentX decode batches mix requests with very different history lengths. MLA processes each history in parallel KV chunks, but assigning the same number of chunks to every request leaves much more work in the chunks of long histories. These long-running chunks extend the kernel's tail. Figure 4 illustrates how per-request split counts balance this work.
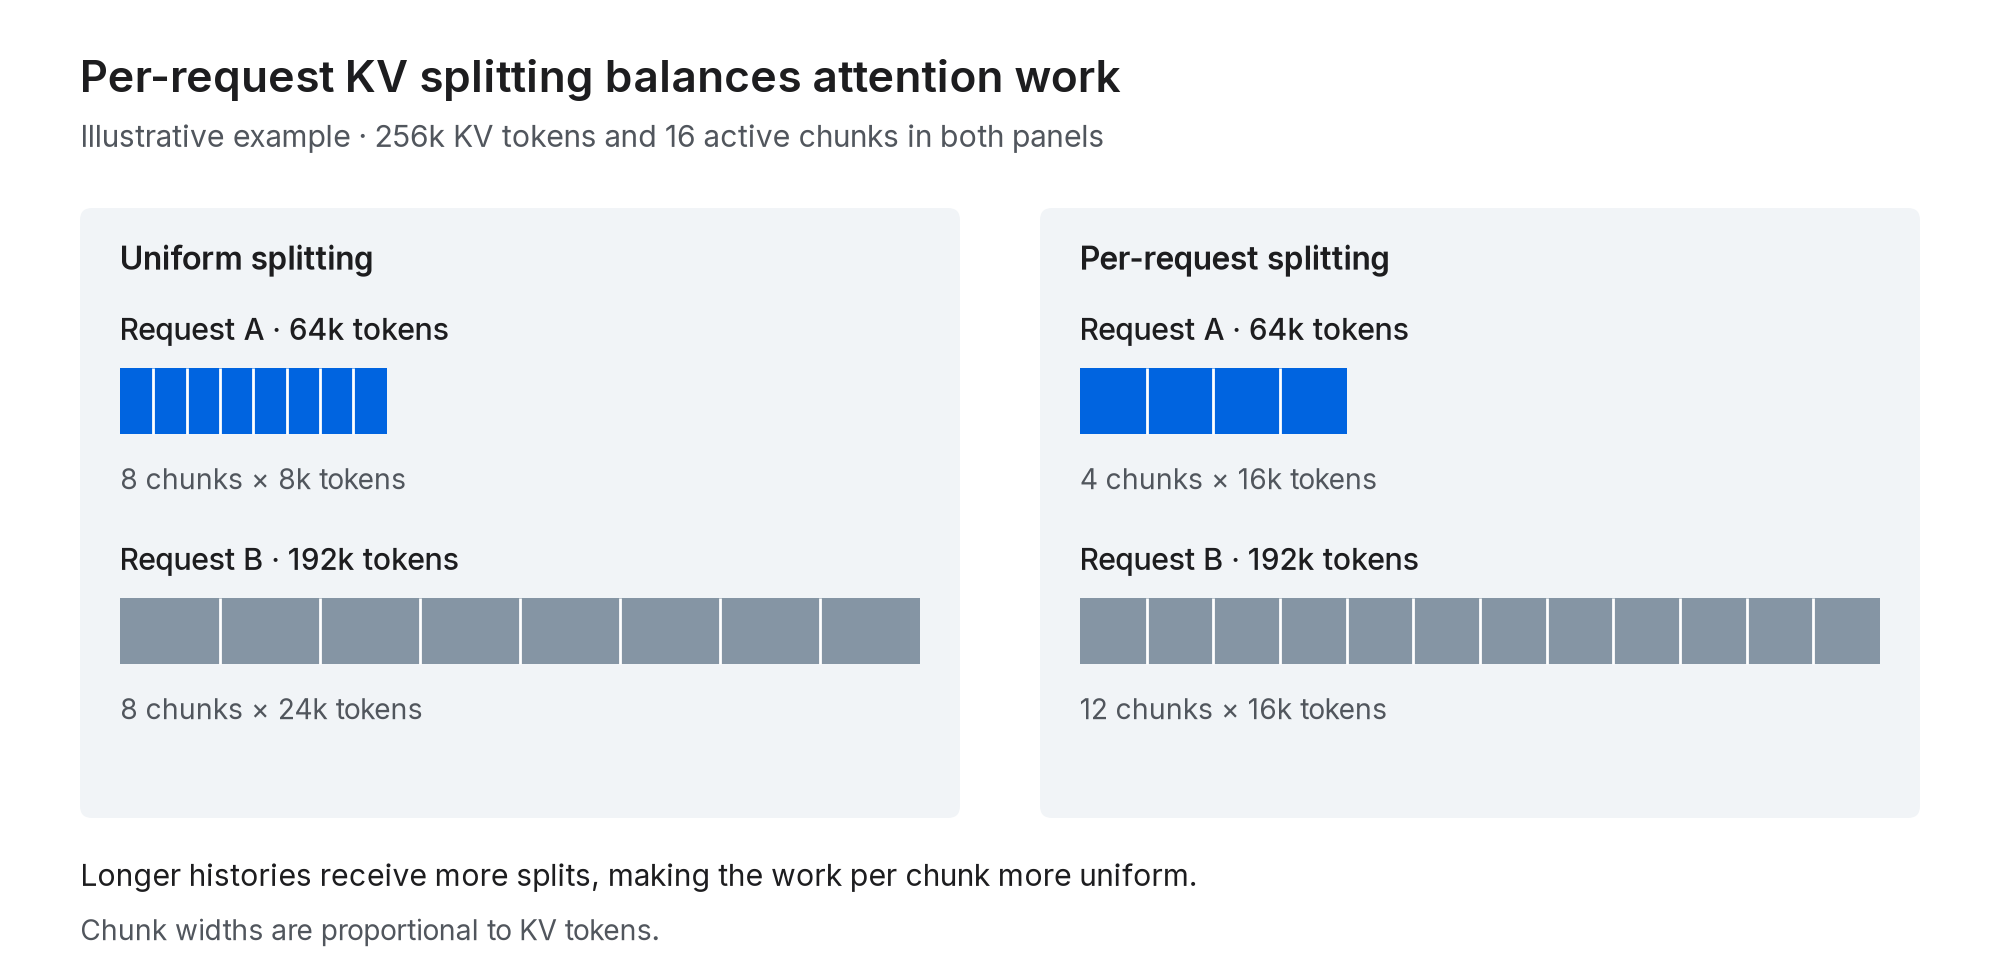
Figure 4. Both panels process the same 256k KV tokens in 16 active chunks. Assigning more splits to the longer history makes the chunk sizes equal in this example.
We derive a target chunk length from the batch's total history and its parallelism budget, then give longer requests more splits and shorter requests fewer. More evenly sized chunks help GPU thread blocks finish closer together. The split counts adapt to the current histories and remain compatible with CUDA Graphs.
Figure 5 compares MLA time per decode step for 12 batches sampled from real serving, using uniform and per-request split counts.
For each batch, we also construct an equal-length control: keep the same number of requests and total KV tokens, but set every request's history to that batch's average length. For example, histories of 64k and 192k become 128k and 128k. This removes history-length imbalance while preserving the amount of KV work.
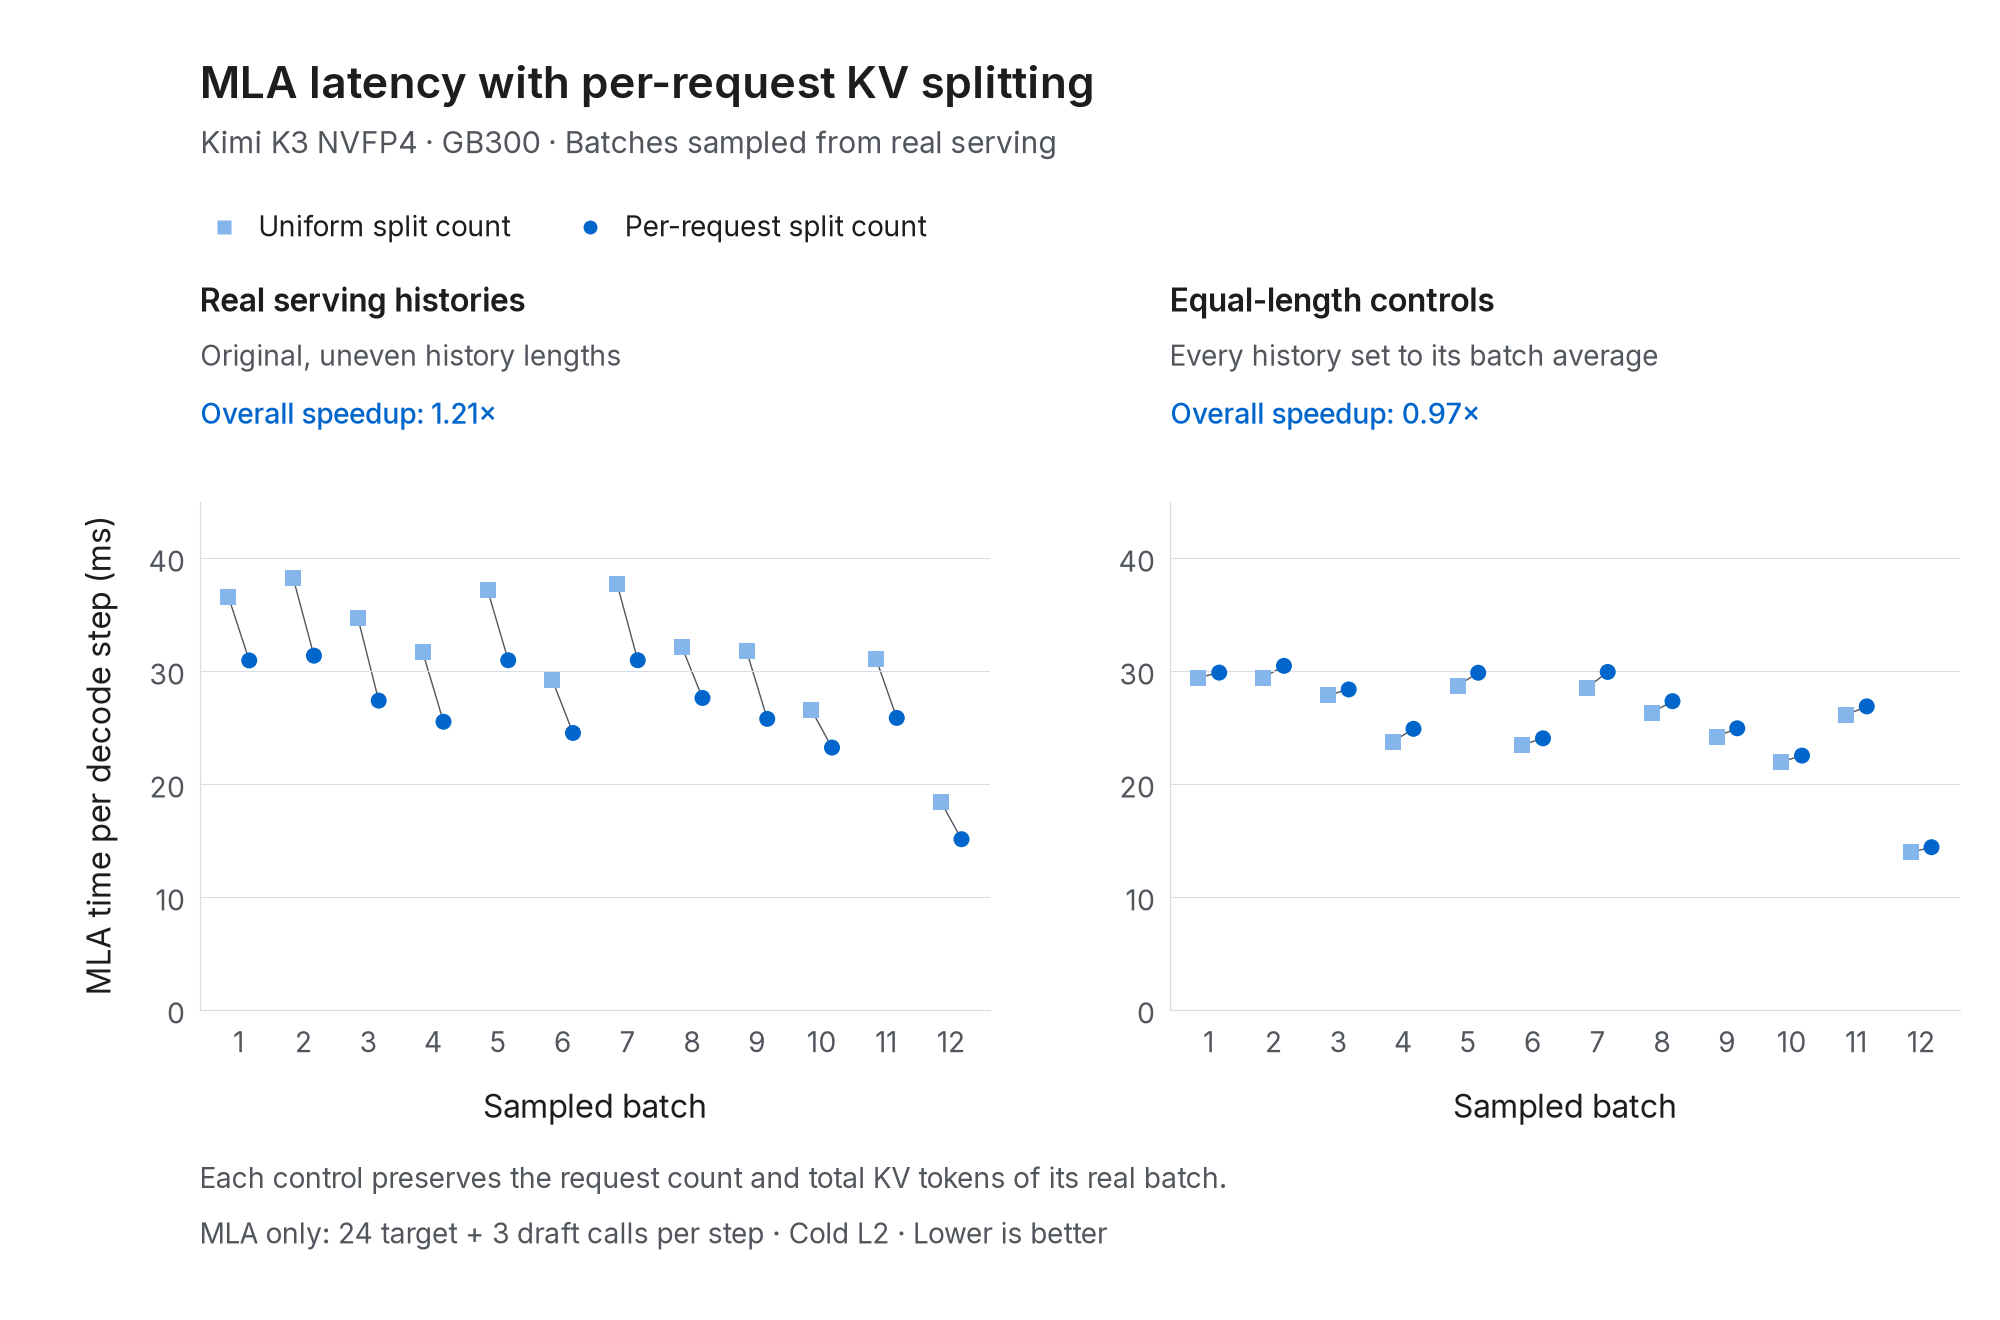
Figure 5. Original serving histories (left) and equal-length controls (right). Each pair compares uniform and per-request splitting. Both panels show MLA time on the same millisecond scale; lower is better.
All 12 mixed-history batches improve, with an aggregate 1.21× MLA speedup. The equal-length controls are about 3% slower: their chunks are already balanced, so the additional splitting overhead brings no corresponding benefit. In serving, the kernel improvement translates into approximately 6% shorter full decode steps at matched running-batch sizes.
Kernel fusion and overlap complete the decode path
Beyond the projection and MLA optimizations above, we reduce intermediate memory traffic and overlap work throughout the decode path:
- MegaMoE fusion. Dispatch, expert computation, and combine are integrated in a persistent implementation, reducing the overhead between these stages.
- Conv1d and KDA fusion. The KDA verification kernel combines depthwise Conv1d, SiLU, Q/K normalization, the recurrent update, and attention-output computation. Keeping these operations together avoids writing and rereading intermediate tensors between separate kernels.
- Normalization, gating, and quantization fusion. Before KDA's output projection, one kernel applies RMSNorm, sigmoid output gating, and FP8 quantization, avoiding separate passes over the attention output.
- Multiple CUDA streams. Shared experts provide work that can overlap the routed-expert path. In our TP4 configuration, their final reduce-scatter overlaps the routed expert output projection, shortening the time until both outputs are ready to combine.
- Programmatic dependent launch (PDL). We use PDL broadly across the decode path. It allows a dependent kernel to begin independent preparation before the preceding kernel finishes, while waiting for its inputs before consuming them. This reduces gaps between successive kernels.
DWDP prefill: independent execution and shared caching
Two challenges: Cache hit and imbalance
The first challenge is cache hit, which determines how much computation is needed for each turn. Consider a 200k-token history followed by a small new turn. Retaining the reusable prefix leaves relatively little new prefill work. Evicting it can turn the next request into a large recomputation. Across a workload, a drop in cache hit from 95% to 90% may seem modest, but it raises the cache-miss rate from 5% to 10%, doubling the number of prompt tokens that require prefill computation.
As Figure 6 illustrates, tool calls and inter-turn delays pause model computation while the histories needed for subsequent turns remain in cache.
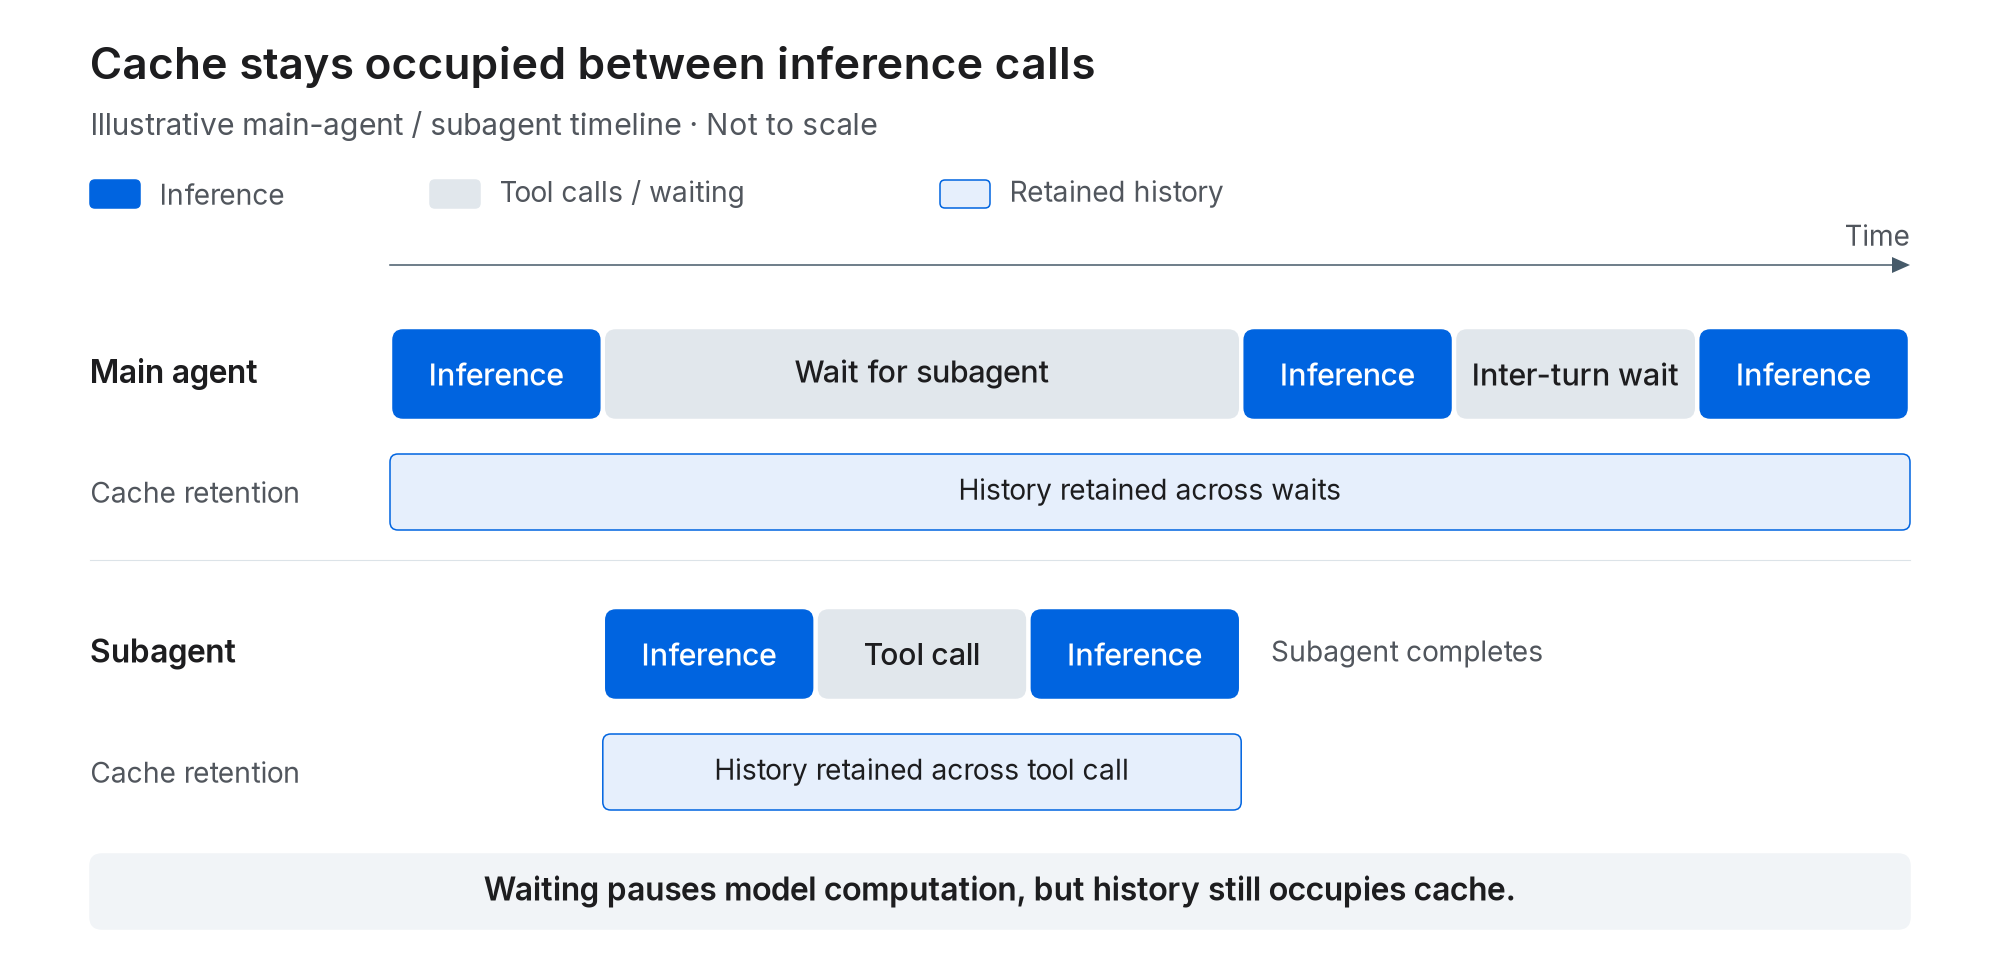
Figure 6. Waiting between turns still requires cache. Inference is intermittent, but retained history spans the waiting periods. The timeline is illustrative, not to scale.
The second challenge is imbalance. Data parallelism is a standard high-throughput serving strategy, but its imbalance is amplified during prefill. It appears at three levels:
- Work within a forward: Ranks process different numbers of new tokens and different history lengths, so their attention costs vary even at the same new-token count. With synchronized expert execution, faster ranks wait for the slowest rank at each layer, leaving compute capacity unused.
- Cache pressure: Conversations assigned to different ranks retain different amounts of history. One rank can run out of cache and evict useful history while another still has spare capacity, causing avoidable recomputation.
- Queued work: Bursty arrivals and different prefill costs can build a long queue on one rank while another has little work. Requests wait behind the busy rank even though compute capacity is available elsewhere.
With rank-local caches, routing faces a difficult choice. Sending a request back to the rank holding its history preserves reuse but may lengthen an already busy queue. Sending it elsewhere may balance compute at the price of recomputing a long prefix.
DWDP: distribute weight storage, execute batches locally
DEP prefill exposes substantial synchronization overhead when ranks process unequal workloads. Figure 7 shows this effect in a DEP16 capture from AgentX serving.
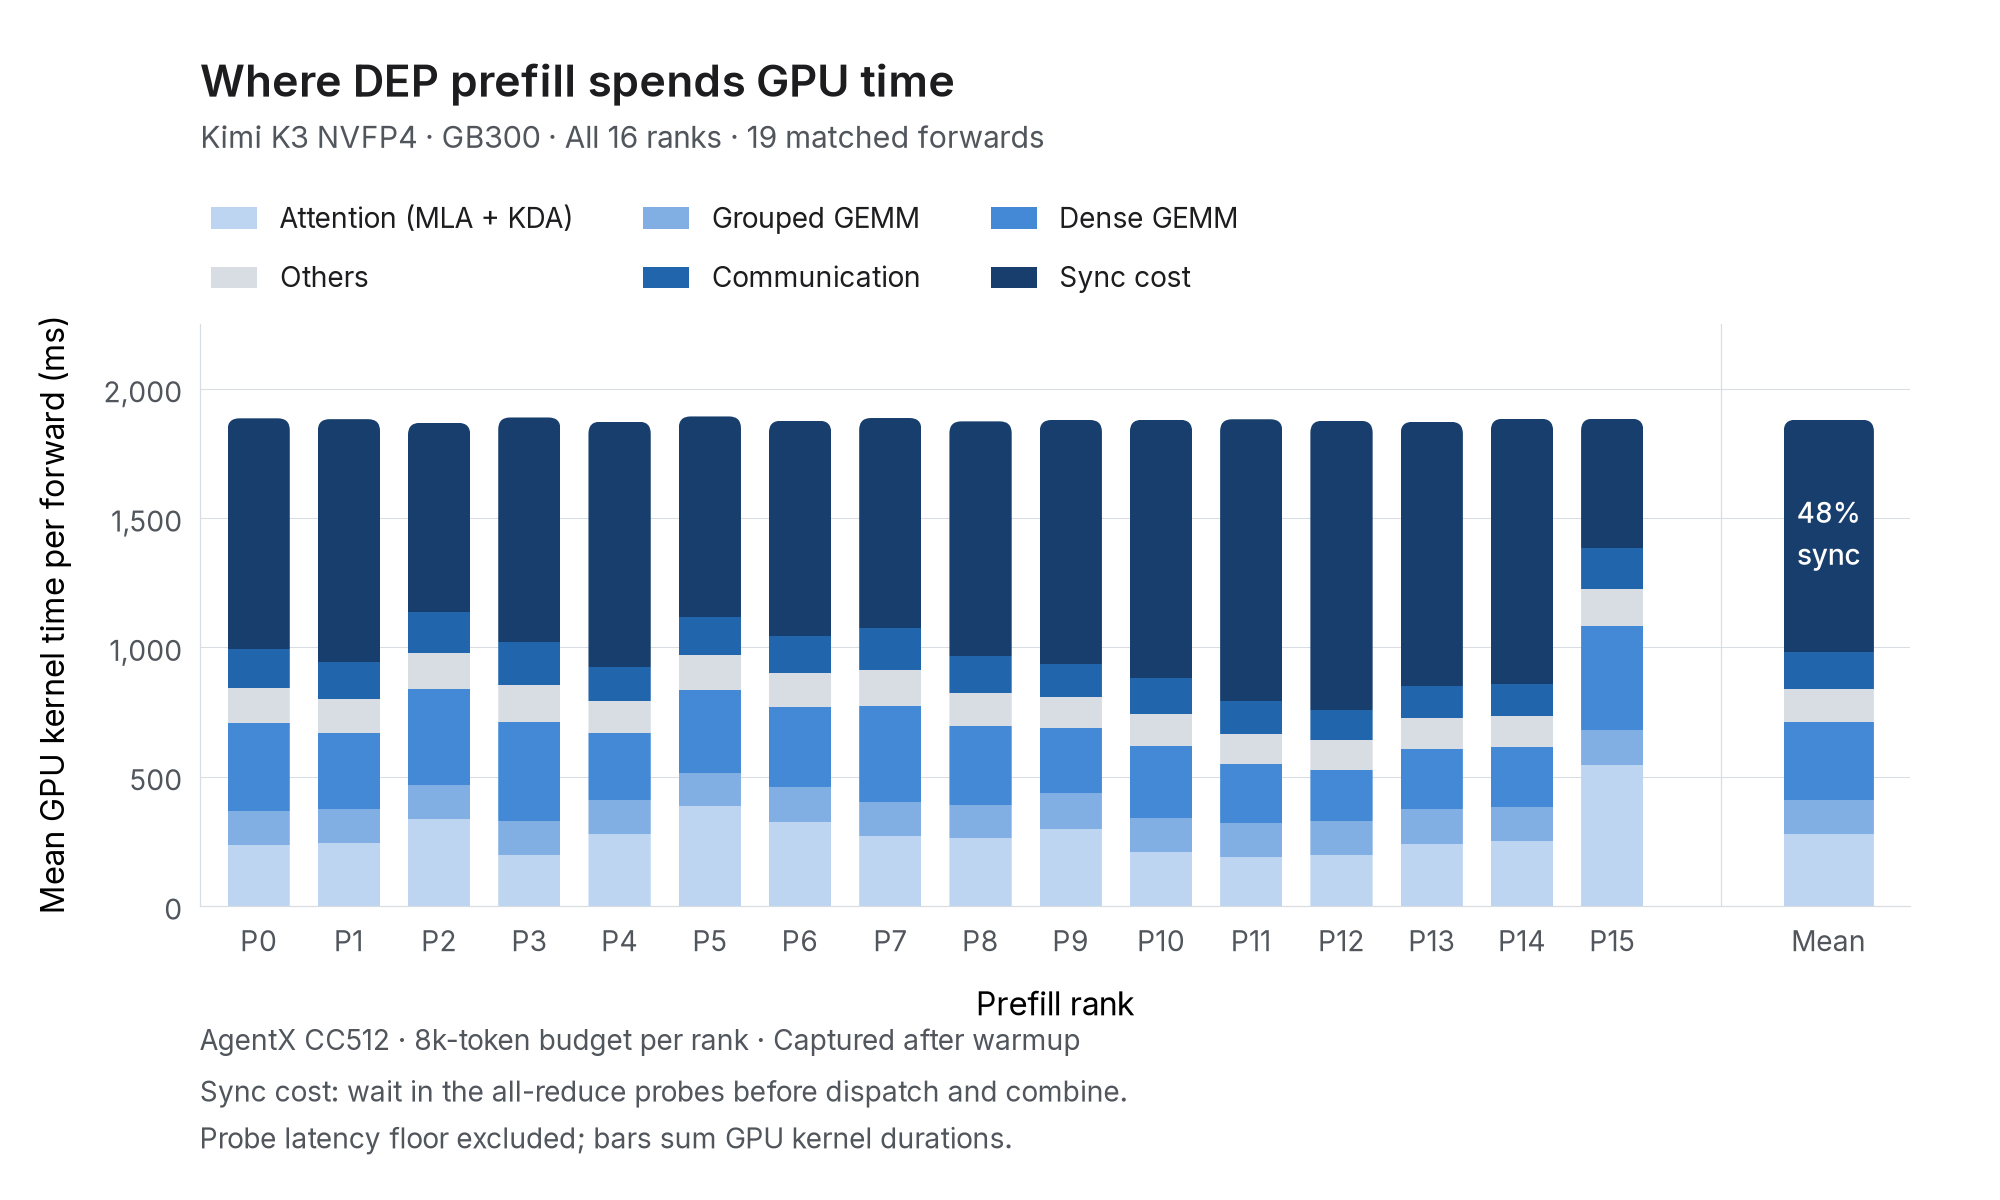
Figure 7. Mean GPU kernel time over 19 matched forwards on all 16 ranks. All-reduce probes before dispatch and combine separate synchronization waiting from communication. Dense GEMM includes attention projections and MLA history expansion. This capture uses separate all-to-all and TRT-LLM-generated MoE kernels, with an 8k-token prefill budget per rank.
Across all 16 ranks, synchronization waiting accounts for approximately 48% of GPU kernel time, compared with 7.5% for the all-to-all communication path. Ranks with less local work spend more time waiting for their peers.
To remove these layer-wise synchronization points, we adopt Distributed Weight Data Parallelism (DWDP), developed in NVIDIA TensorRT-LLM. Each rank progresses independently, allowing a faster rank to finish its work and admit another batch without waiting for slower peers at every MoE layer.
Expert weights remain sharded across GPUs. Each rank fetches remote expert weights and executes attention and MoE locally on its own tokens, preserving full GEMM dimensions and eliminating inter-rank activation dispatch/combine. Weight reads do not require the owning rank to reach the same layer. Our deployment therefore has 16 independent prefill ranks sharing expert-weight storage.
To hide weight movement, TokenSpeed uses two alternating staging buffers and a separate copy stream. While computation consumes one buffer, the next layer's weights are fetched into the other. Figure 8 illustrates how this fetch overlaps the current MoE and the following attention and projection work:
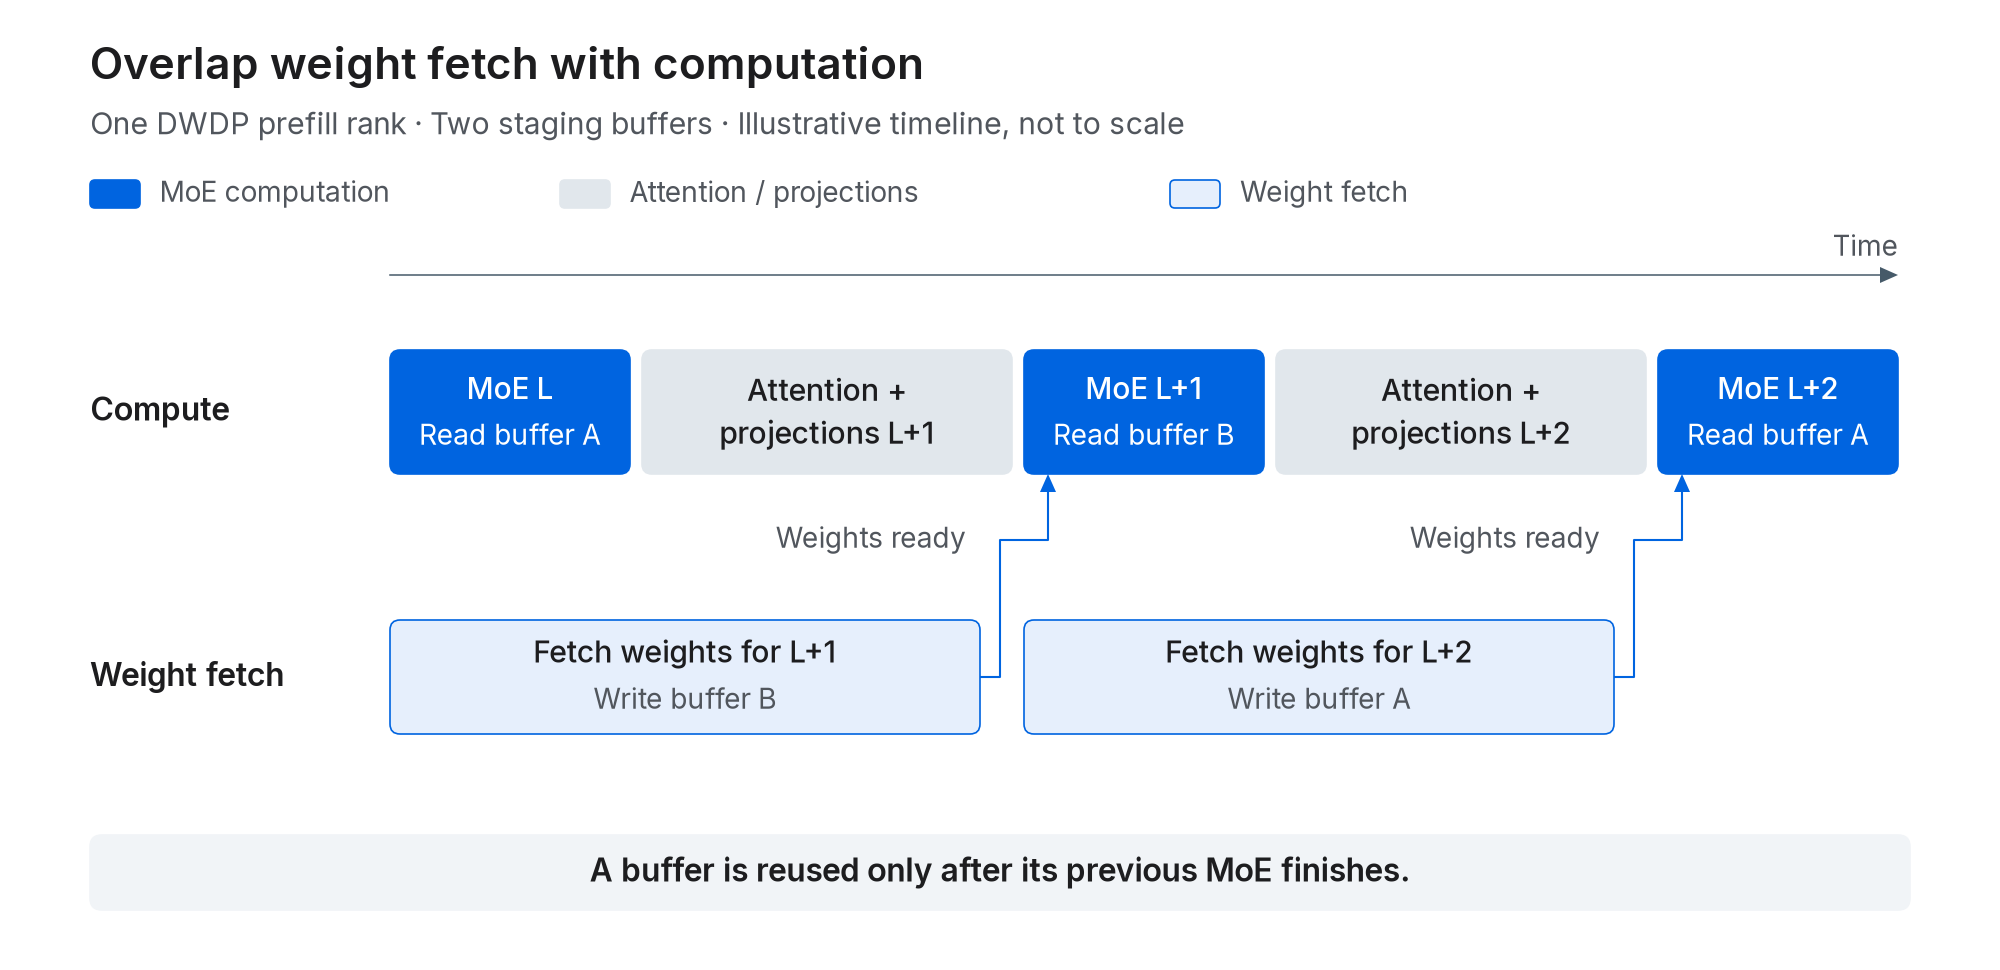
Figure 8. Weight-prefetch overlap. Fetching the next layer's weights overlaps the current MoE and subsequent attention and projection work. Buffers A and B alternate; each MoE starts once its weights are ready. Illustrative timeline, not to scale.
Following TensorRT-LLM’s design, we use chunked copy-engine transfers to overlap weight fetching with computation while keeping SMs available for model execution. In real serving, these transfers achieve approximately 700 GB/s per prefill rank, about 78% of GB300’s 900 GB/s peak unidirectional NVLink bandwidth.
The tradeoff is batch size. Large batches improve weight reuse and MoE efficiency while providing enough computation to overlap weight fetch. Figure 9 compares full-layer compute at different batch sizes and estimates the fetch time that remains exposed with two buffers. Each batch contains four requests with 128k cached tokens per request.
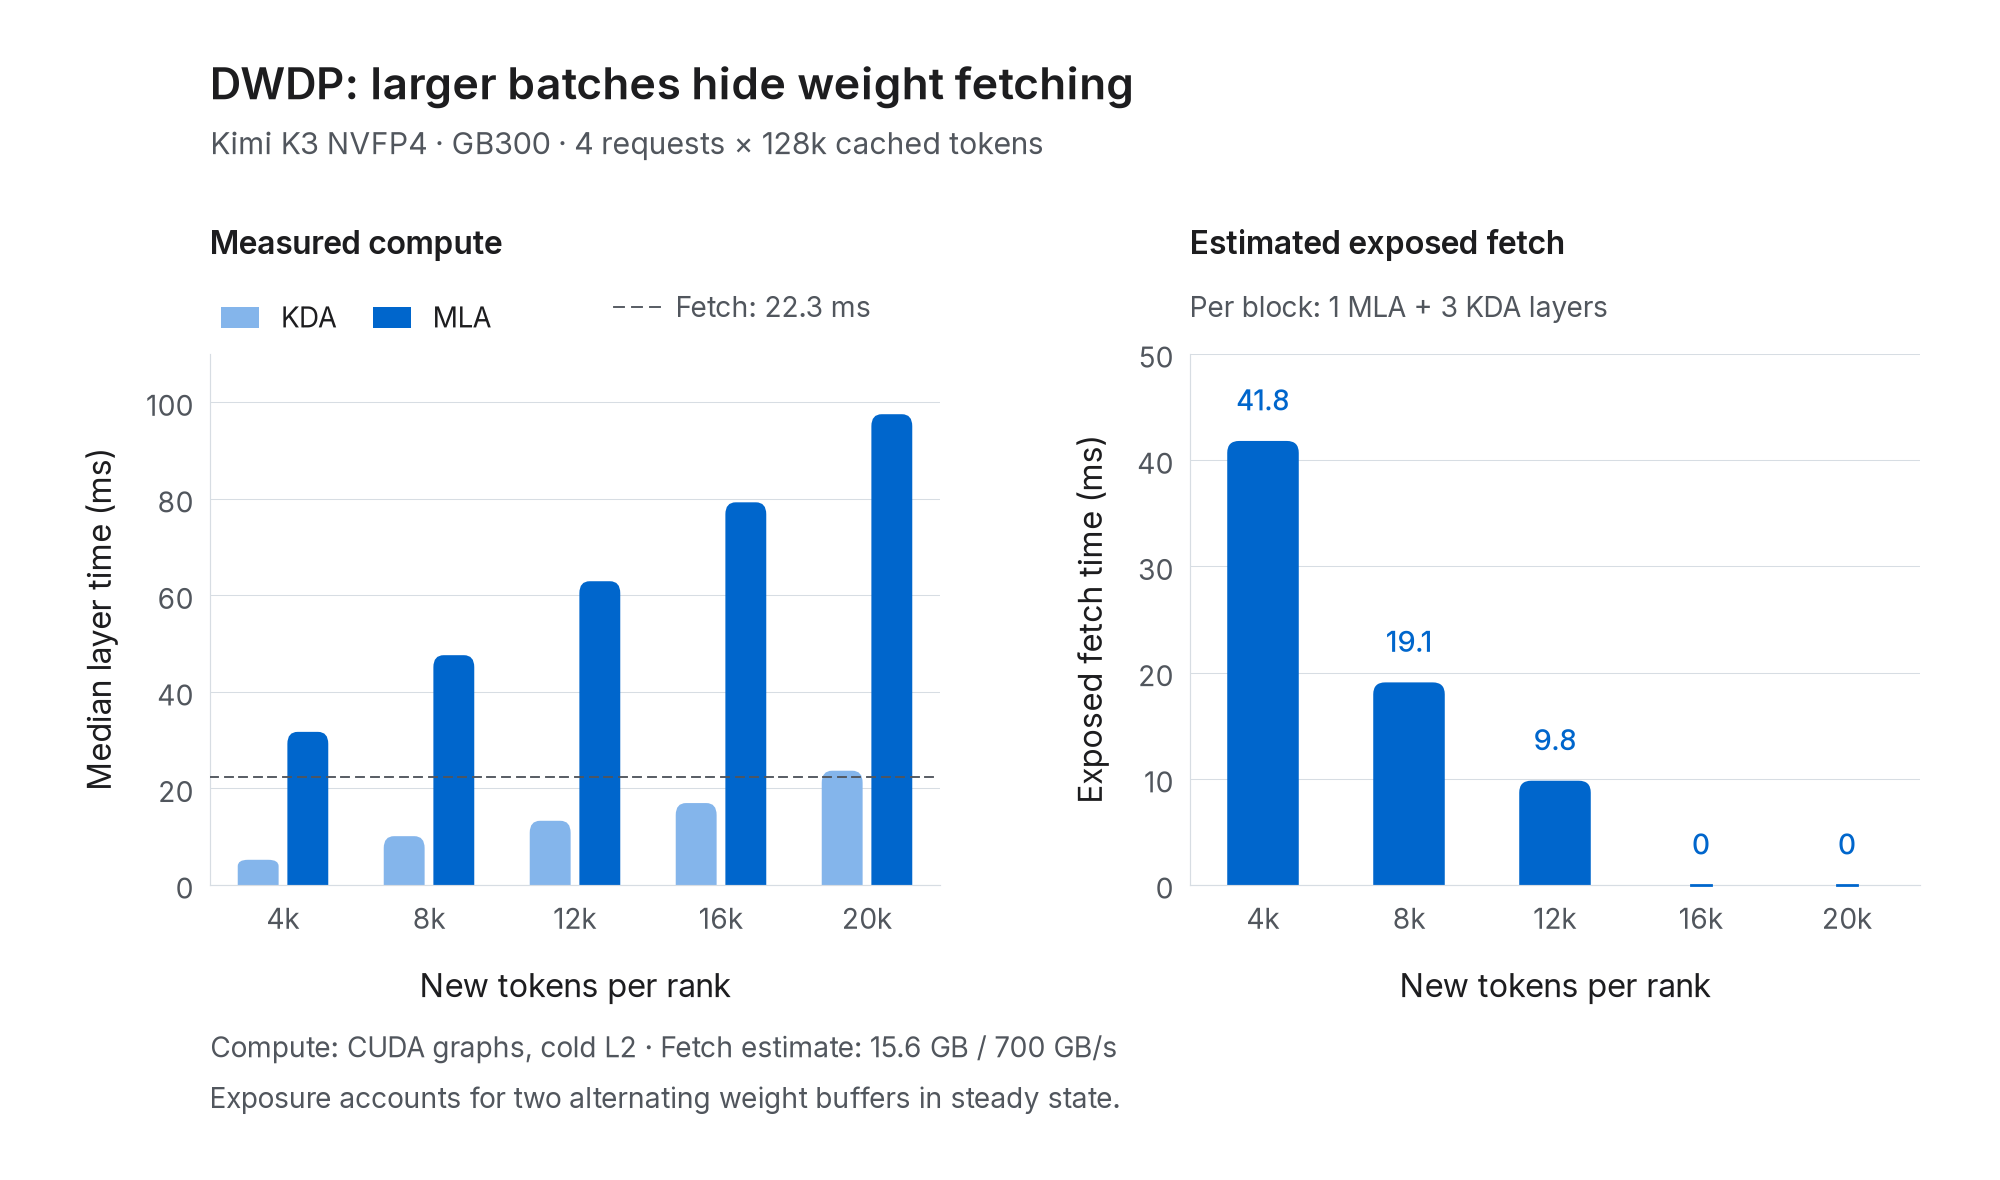
Figure 9. Measured KDA and MLA layer compute (left) and estimated exposed weight fetch per block of one MLA and three KDA layers (right). The dashed line marks 22.3 ms of estimated fetch time per layer; the exposure model accounts for both alternating buffers.
A KDA layer alone is shorter than one weight fetch even at 16k tokens. However, the longer MLA layer provides overlap that carries into the following KDA layers. Accounting for this sequence and buffer reuse, estimated exposed fetch falls from 41.8 ms at 4k to 9.8 ms at 12k, with no exposed fetch at 16k or 20k under the measured conditions.
For one MLA-plus-three-KDA block, we estimate exposed fetch as
where
We use a 16k-token budget per rank per forward. In a long-context serving measurement at this batch size, approximately 3.1 s of compute fit into a 3.1 s forward, consistent with nearly complete overlap. Small, underfilled batches expose more fetch time; they still run without waiting for a full batch.
Shared L2 makes cache reuse independent of the chosen prefill rank
We extend the ordinary host-memory L2 cache into a pool shared across all eight nodes. It retains KV history and KDA checkpoints, and prefill ranks read and write it through RDMA. Decode nodes contribute host memory as well: our decode path does not need its own L2 for prefix reuse.
The deployed pool provides 5.45 TB of cache. Using the earlier estimate of approximately 3.35 GB for a 200k-token request with FP8 KV and two BF16 KDA checkpoints, this is enough to retain roughly 1,600 such request histories.
Figure 10 illustrates successive turns running on P3 and P11 while reusing history from the shared pool.
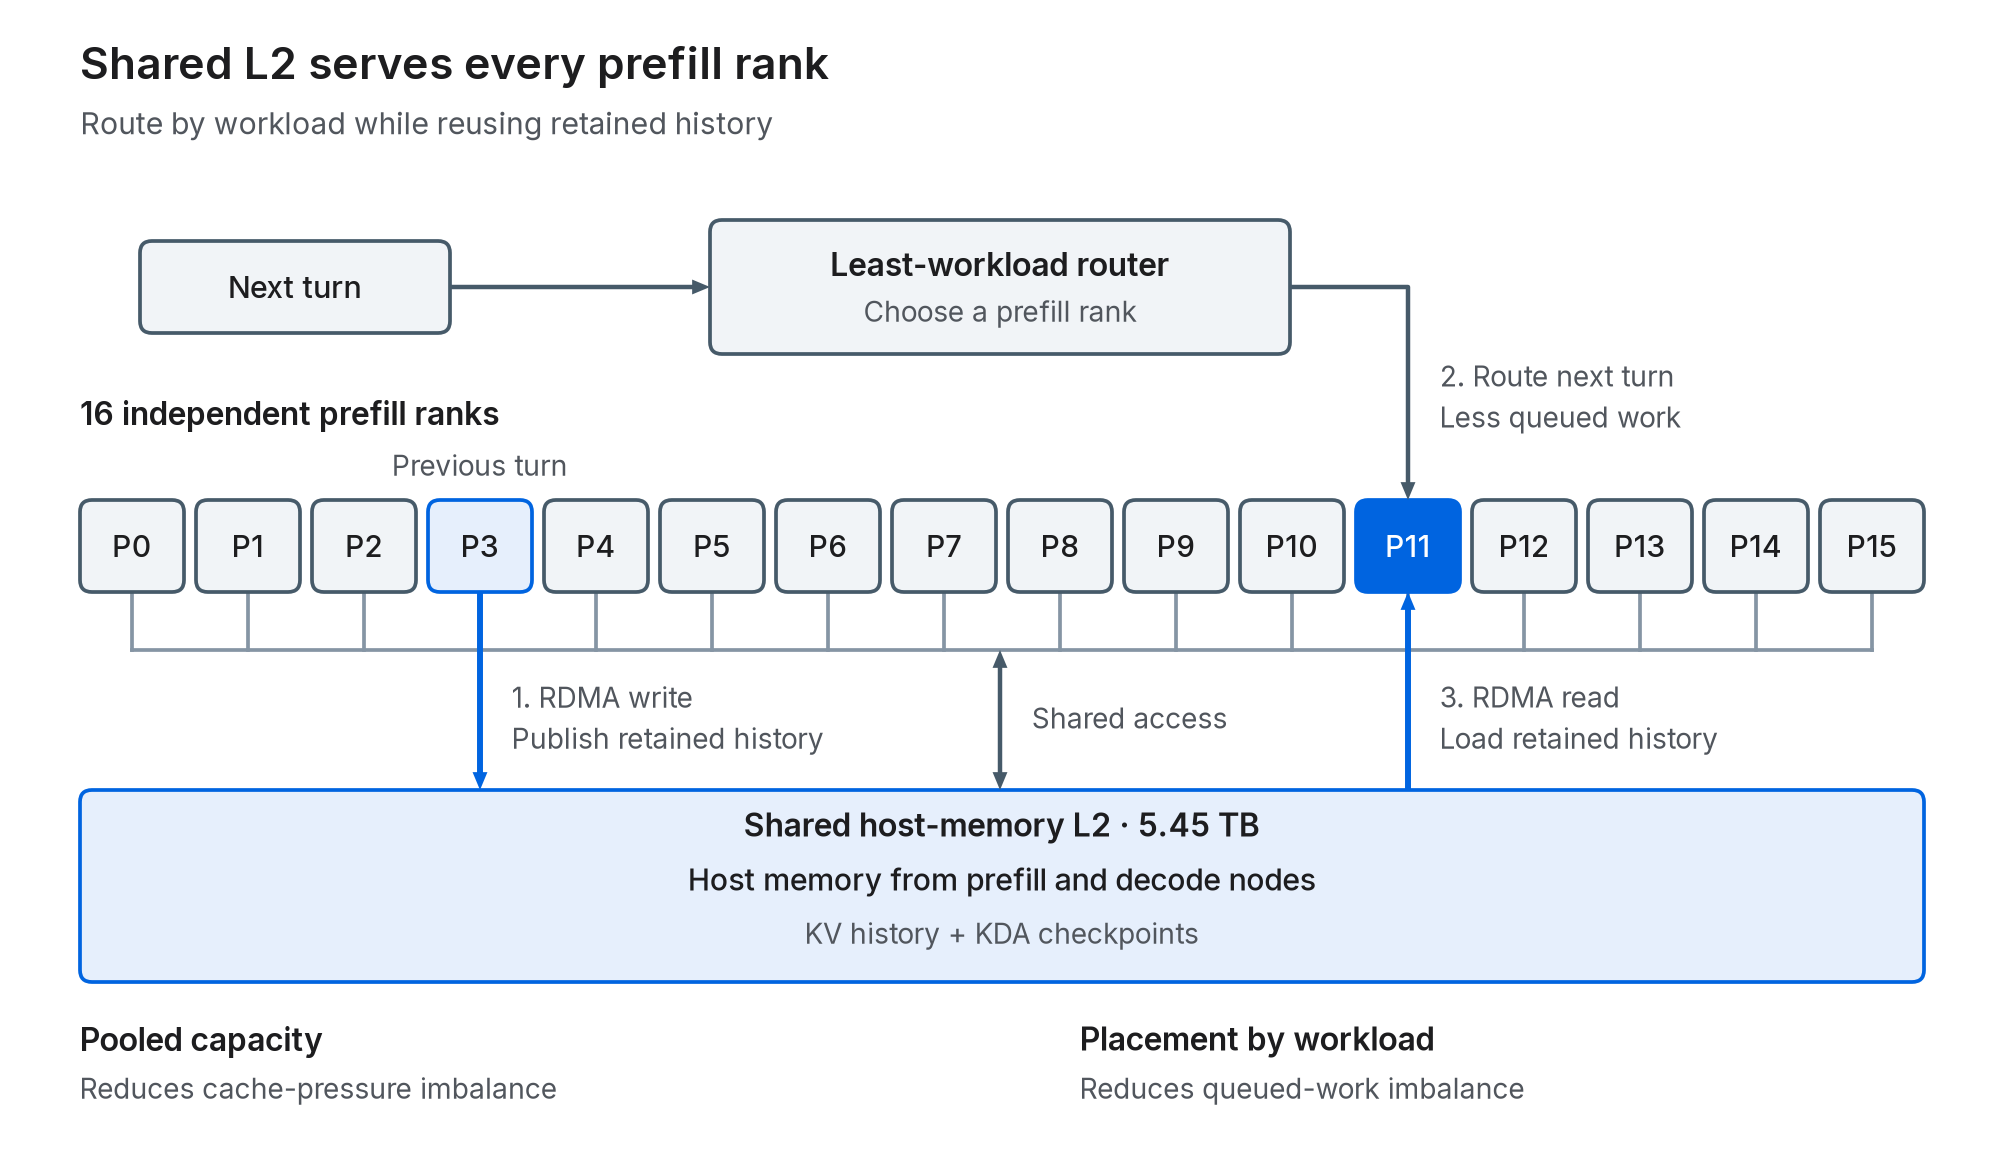
Figure 10. A 5.45 TB host-memory pool spans prefill and decode nodes. All 16 prefill ranks read and write it through RDMA.
Pooling capacity reduces cache-pressure imbalance. A rank serving longer histories can draw on the shared capacity, avoiding eviction from an overfull private host cache while memory elsewhere remains unused.
Shared access also enables least-workload routing to reduce queued-work imbalance. The router selects the rank with the least estimated outstanding prefill work, accounting for token counts. A continuation or subagent can reuse retained history on the selected rank, freeing placement from the rank that originally cached it.
Cache loads proceed layer by layer and overlap model computation. New cache entries are published to the shared pool for subsequent requests.
P/D scheduling: wait only at the dependency that requires it
Ideal scheduling should start independent work as early as possible and wait only when the next operation requires its result. Waiting prematurely leaves compute capacity idle and reduces the number of requests progressing through the system. For P/D serving, the steady-state utilization goals are:
- Prefill queues: Requests should wait for occupied prefill capacity; decode admission should not block their progress.
- Prefill batches: When ready work remains queued and resources permit, batches should fill the prefill token budget.
- KV transfer: Once prefill completes, transfer should start as soon as decode’s destination memory is ready.
- Overall pipeline: Most active requests should be decoding, with minimal time spent queued or waiting between stages.
Independent P/D admission removes one unnecessary dependency in this lifecycle. Figure 11 follows a request from arrival through completion. SMG selects a prefill rank by outstanding workload and a decode rank by request load, without conversation affinity on decode. Prefill and decode admission proceed in parallel, then meet at KV transfer before decoding and streamed output.
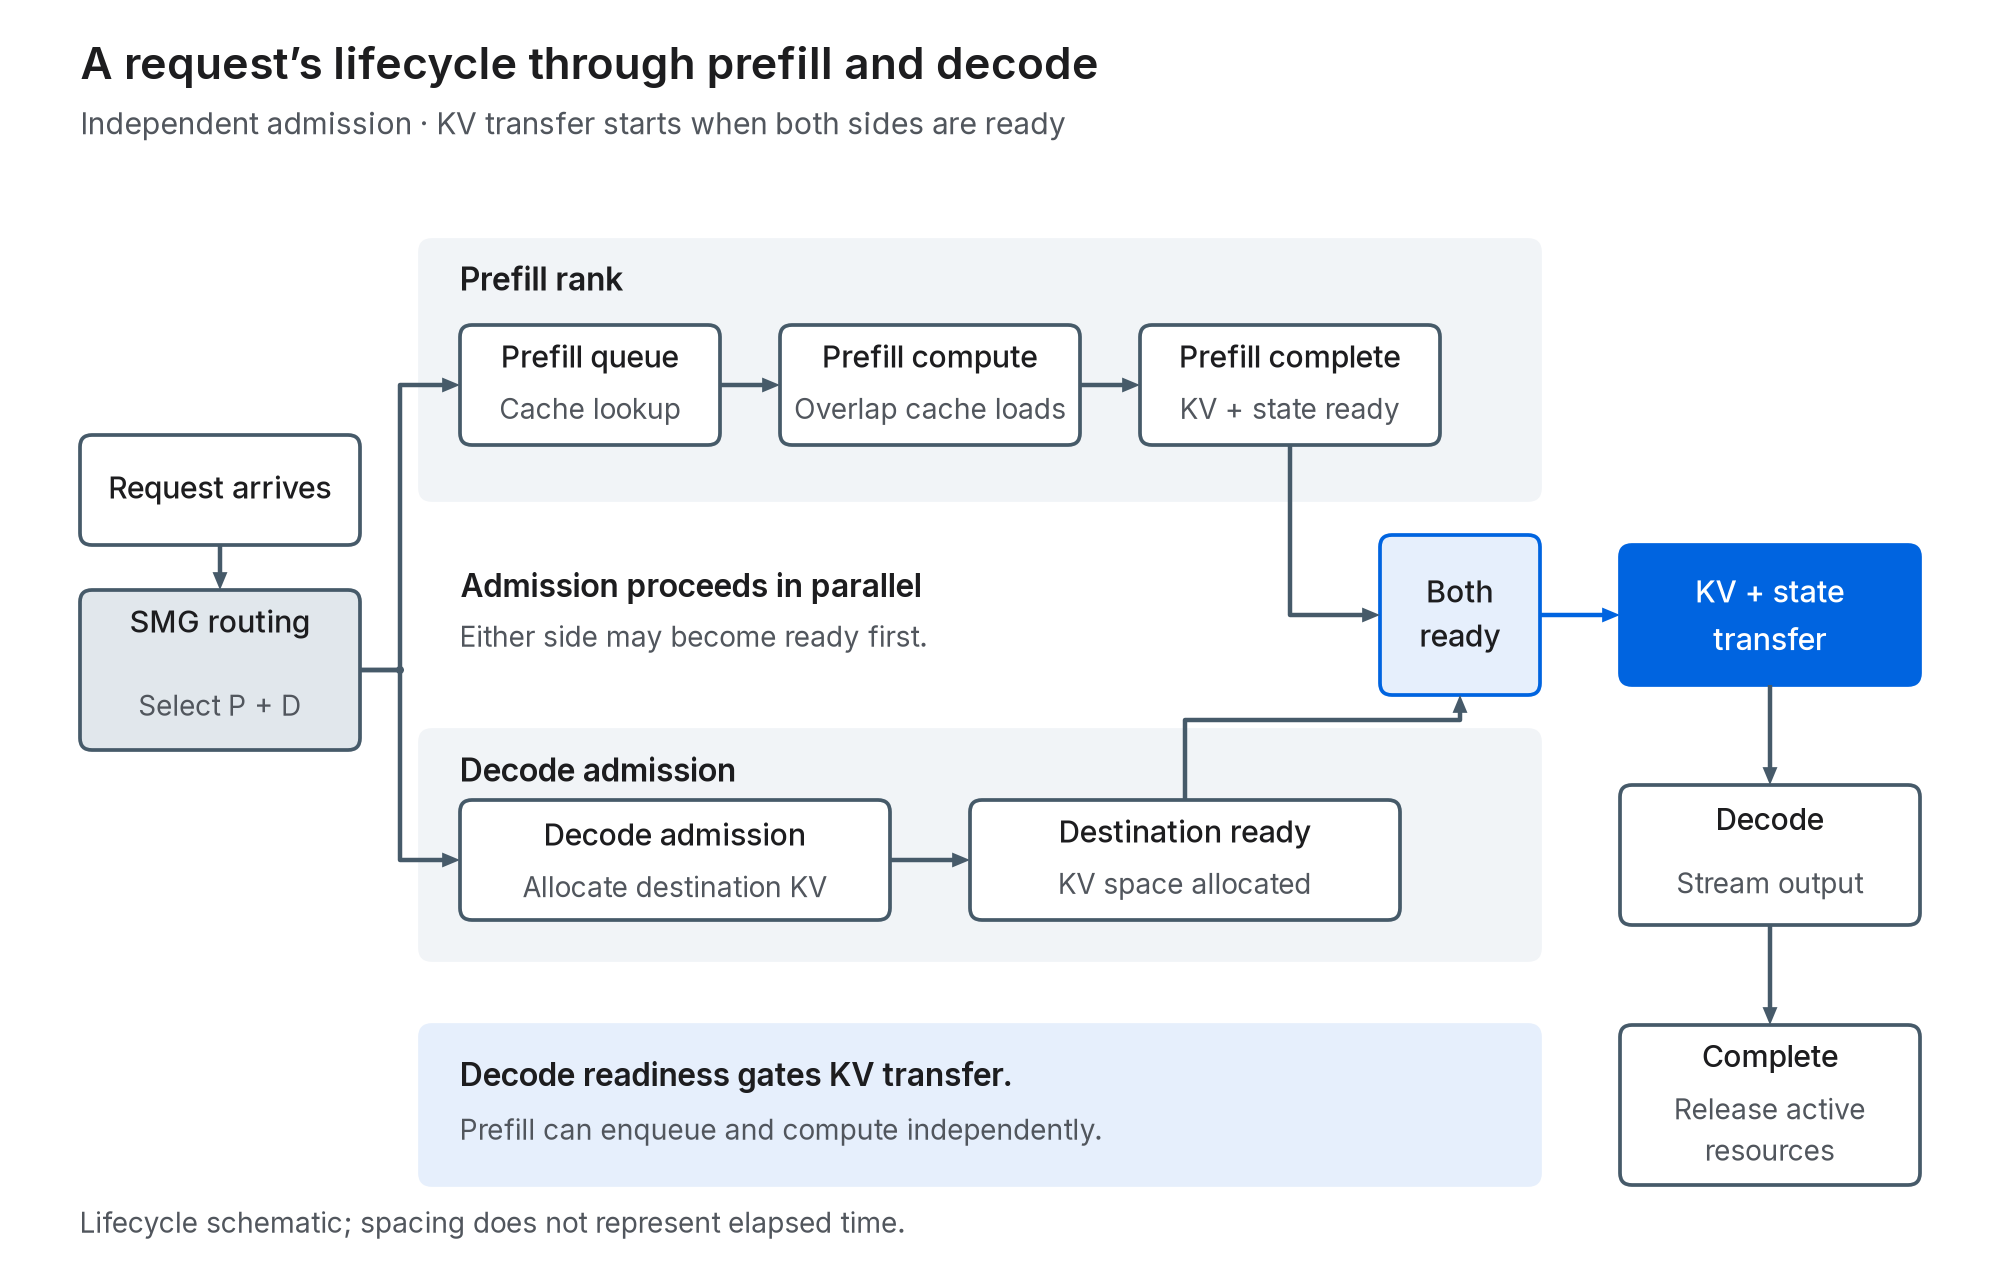
Figure 11. Request lifecycle with independent prefill and decode admission. Both paths must be ready for KV transfer; decoding, streamed output, and completion follow.
Decode admission provides a concrete example. Previously, decode readiness blocked prefill enqueue. Yet prefill computation does not require destination KV space; KV transfer does. We therefore allow prefill to enqueue and compute independently, while decode admission still starts on arrival. Decode readiness is enforced immediately before transfer.
If prefill finishes first, it retains the completed cache until decode is ready. This uses prefill capacity and preserves backpressure when decode cannot keep up.
In a control experiment at concurrency 384 on an earlier software revision, independent admission reduced mean prefill queue time by 28.3%, increased the average active decode batch by 4.8%, and improved output throughput per GPU by 3.8%.
AgentX benchmark results
We use a single eight-GPU DCP8 deployment as the standard Kimi K3 serving baseline and compare it with our 32-GPU DWDP16 + DEP16 system.
Decode context parallelism (DCP) distributes MLA’s KV cache across GPUs, avoiding its replication across TP ranks. During decode, each rank attends to its local KV partition, then combines the partial attention results. Small-batch performance remains close to TP, while the larger effective cache capacity supports higher concurrency.
DCP8 reaches its highest measured output throughput at concurrency 72. Comparing this with DWDP16 + DEP16 at concurrency 576, we achieve 1.92× output throughput per GPU: 331.18 versus 172.76 output tokens/s/GPU.
Both configurations use the full AgentX trace and a one-hour scored sending window after warmup. Reported throughput includes the drain of requests still in flight at cutoff. DCP8 uses DSPark with 4 speculative steps and forced acceptance length (AL) 3.22; DWDP16 + DEP16 uses EAGLE3 with 3 speculative steps and forced AL 3.0. The results are not normalized for acceptance length.
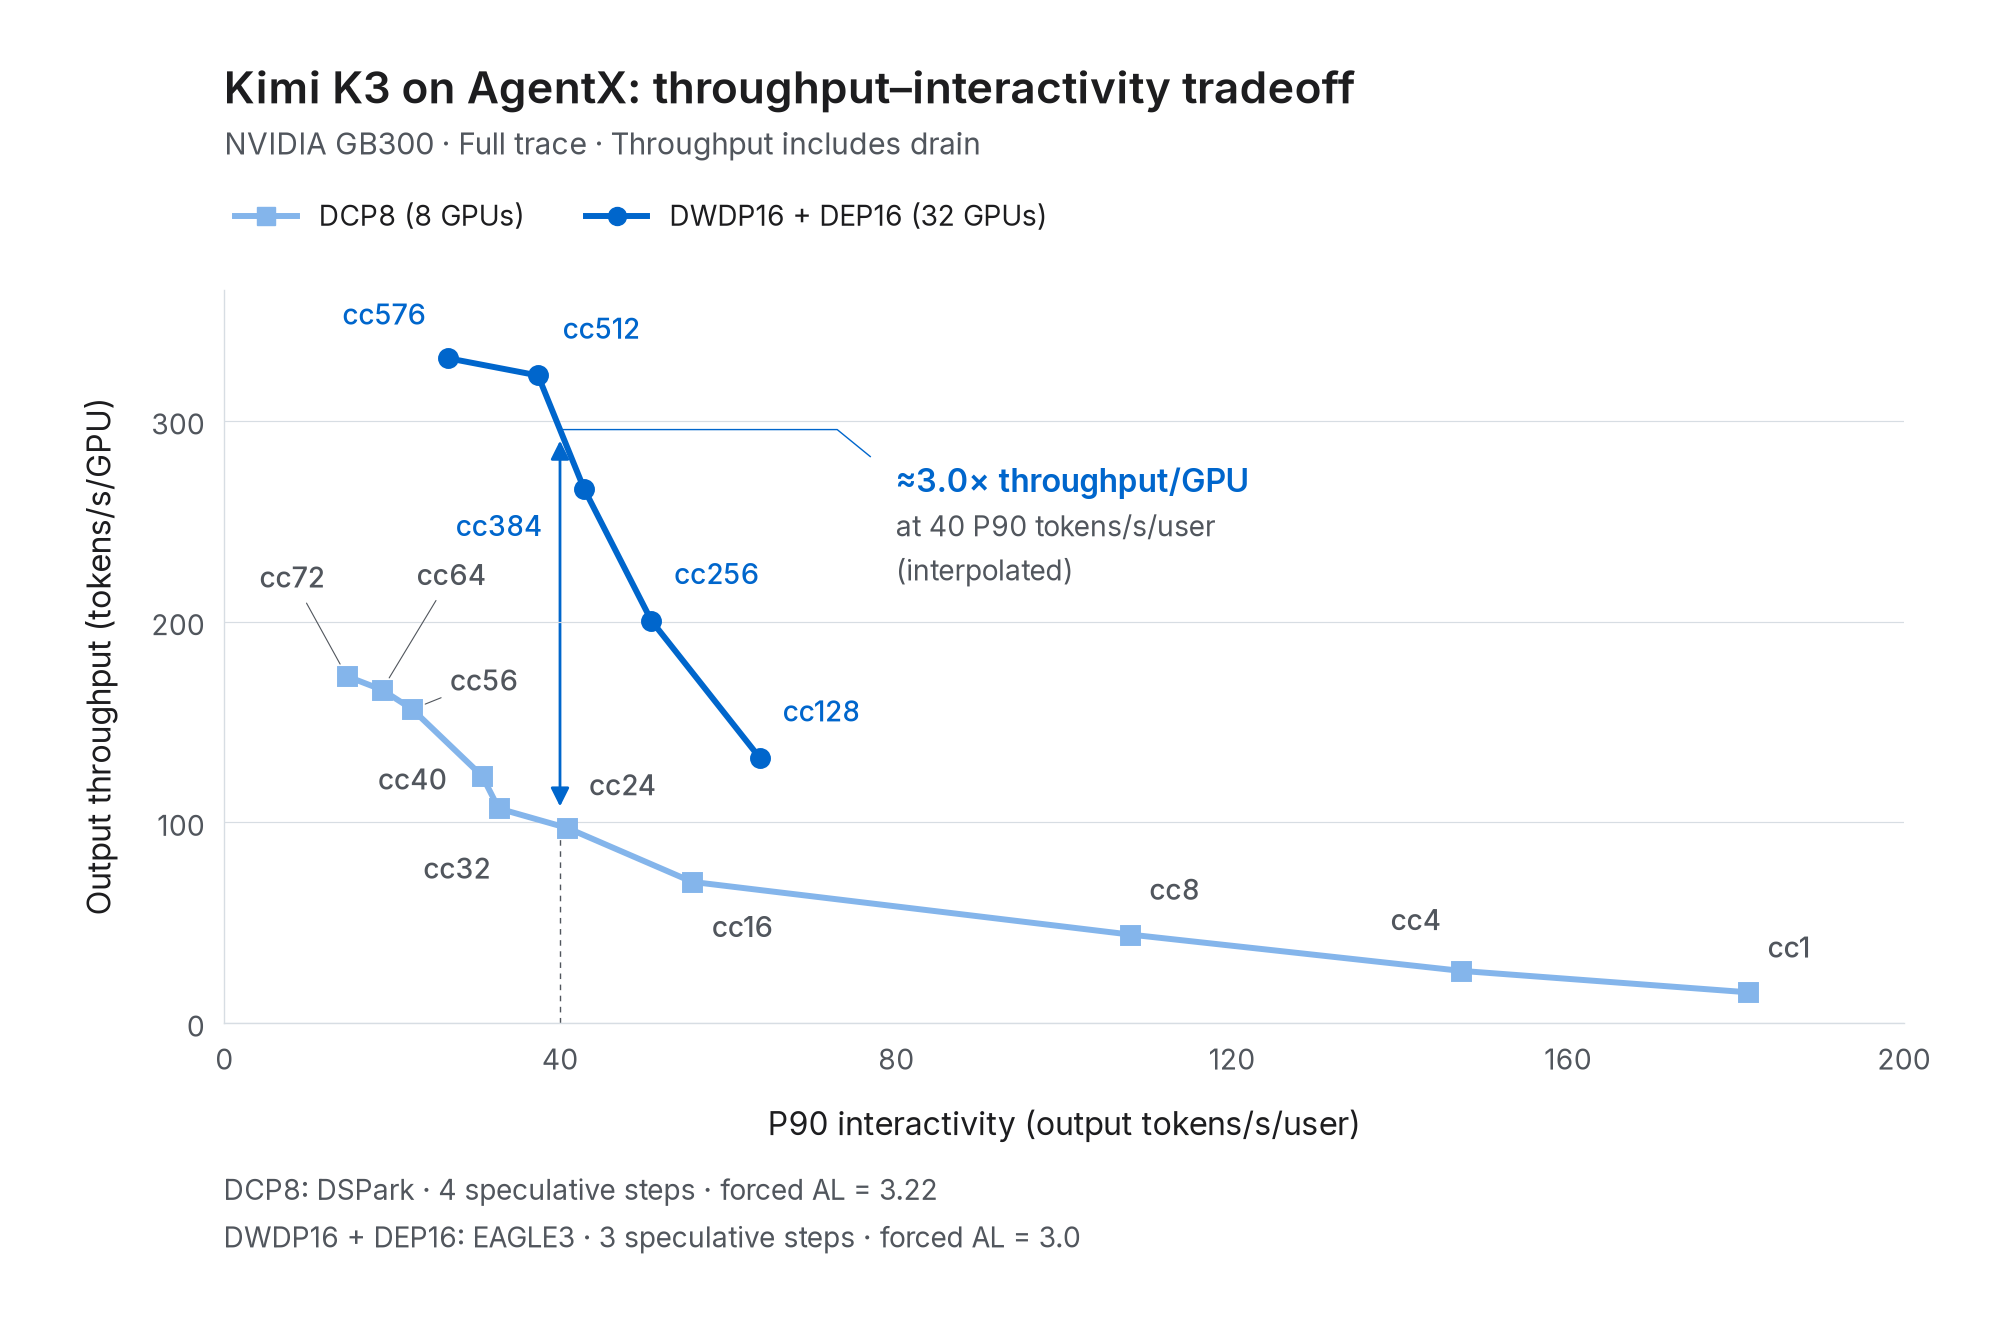
Figure 12. AgentX throughput–interactivity tradeoff on GB300. The x-axis shows P90 interactivity (output tokens/s/user); the y-axis shows output throughput (output tokens/s/GPU), including request drain. Higher is better on both axes, and point labels indicate client concurrency. Throughput is normalized across all GPUs: 8 for DCP8 and 32 for DWDP16 + DEP16.
At a matched P90 interactivity of 40 tokens/s/user, linear interpolation between neighboring measured points estimates approximately 3.0× output throughput per GPU, as marked in the figure.
At concurrency 576, PD has P90 interactivity of 26.70 tokens/s/user, compared with 14.62 for DCP8 at concurrency 72. Concurrency 512 offers a useful balance: 322.61 output tokens/s/GPU (1.87× DCP8 at concurrency 72), with higher P90 interactivity of 37.38 tokens/s/user.
Prefill cache hit remains approximately 95.4% at concurrency 512 and 95.3% at 576, counting reuse from GPU and shared host memory. DCP8 reports 95.05% at concurrency 72. The PD system retains a similar level of prefix reuse while serving a much larger population of sessions.
The throughput gain comes with longer time to first token. Mean TTFT is 13.25 s at concurrency 512 and 14.47 s at 576, versus 1.06 s for DCP8 at concurrency 72. PD’s P90 TTFT is 22.58 s and 27.03 s, respectively. These high-concurrency points prioritize aggregate throughput. P90 interactivity measures token generation after the first token; TTFT captures the wait before generation begins.
Throughput over time
AgentX’s throughput metric includes the ramp and drain durations. Figure 13 shows how throughput evolves during the concurrency-512 run, with warmup illustrated separately.
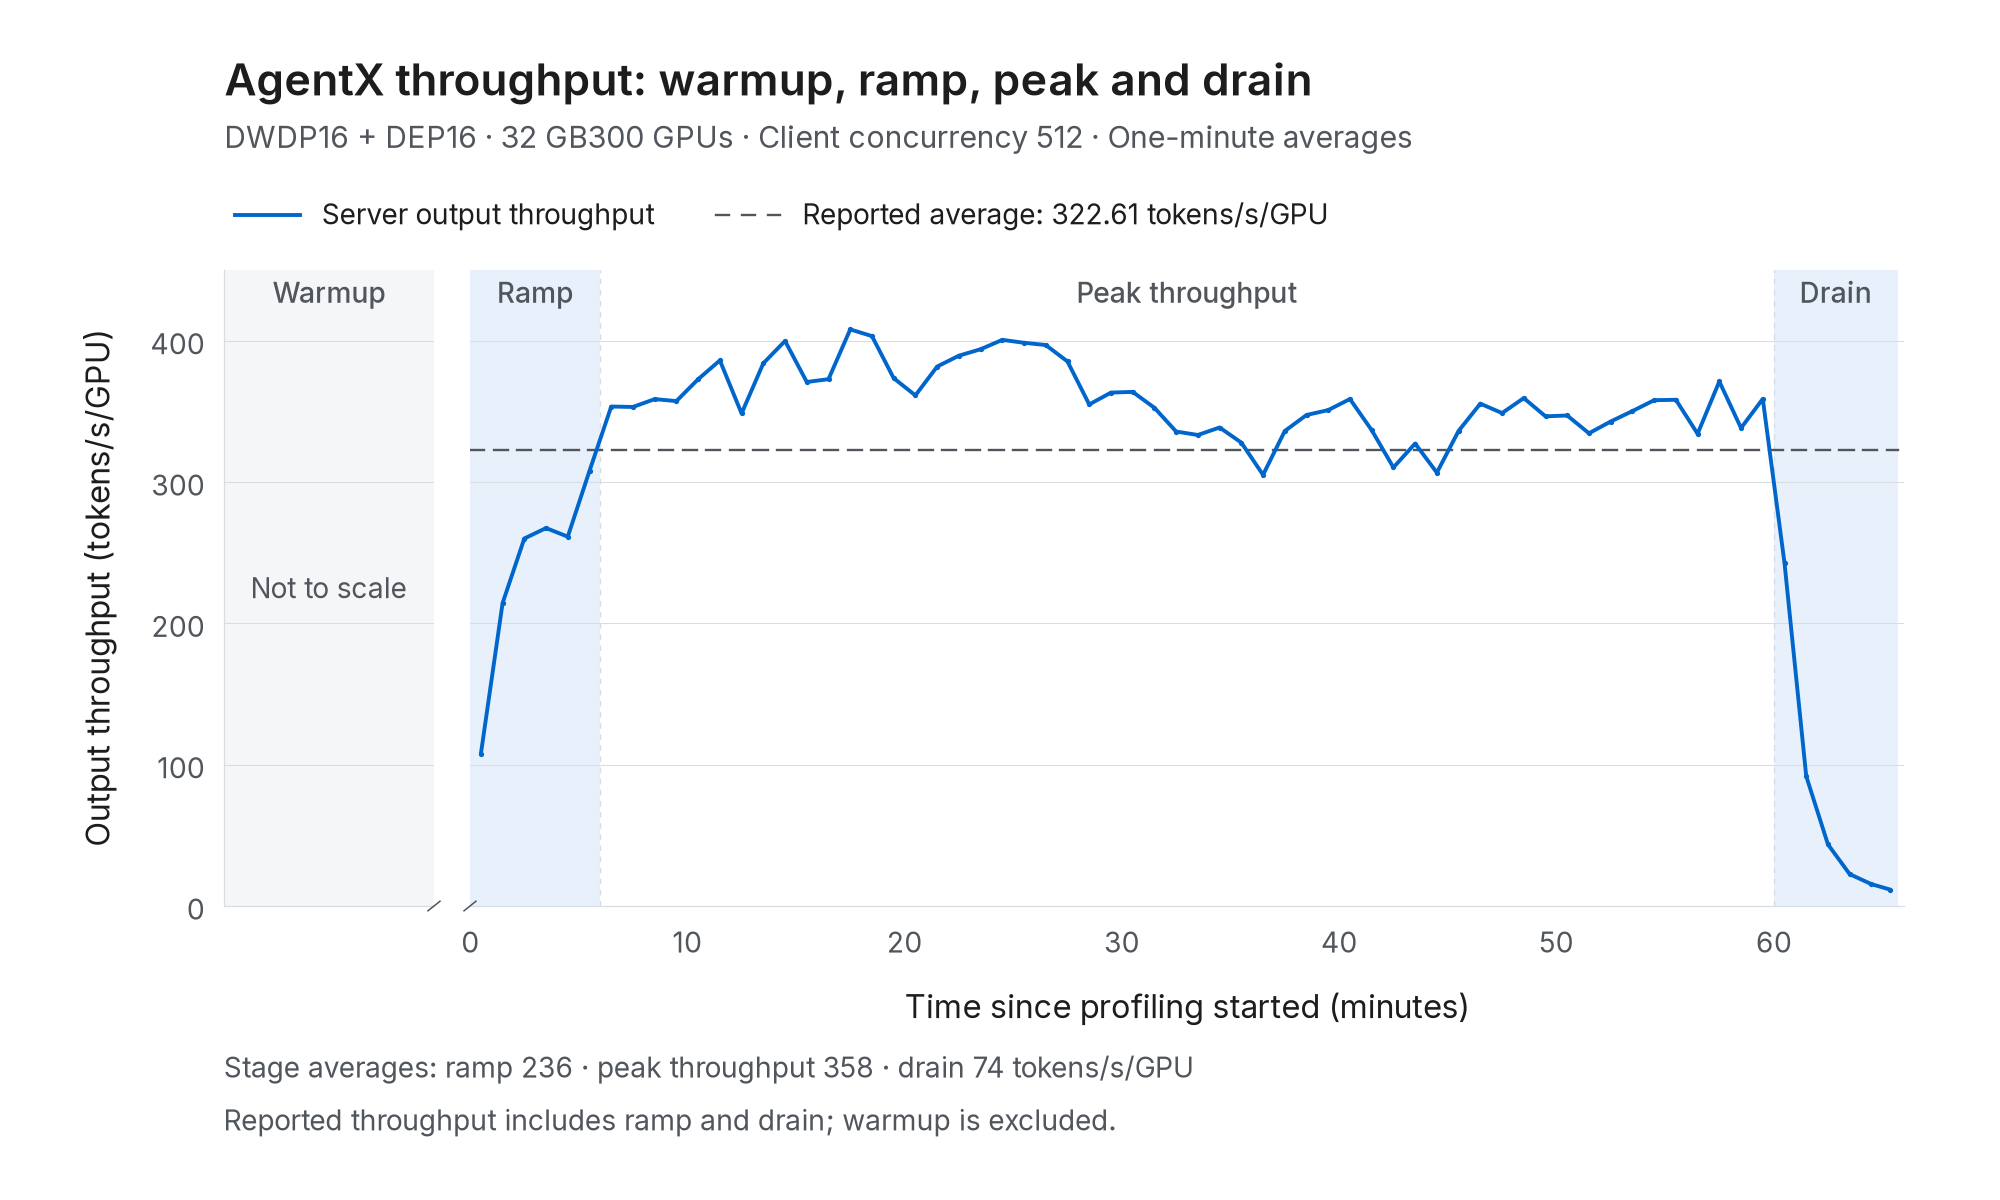
Figure 13. Throughput over the concurrency-512 run. One-minute averages from server logs, normalized across all 32 GPUs. The dashed line marks the reported 322.61 output tokens/s/GPU, including ramp and drain. Time starts at profiling minute zero. The preceding warmup is shown as a shortened illustration, not to scale, and is excluded from the measurement.
After a roughly six-minute ramp, the system averages 358 output tokens/s/GPU during the 54-minute peak-throughput stage.
Acknowledgements
We thank NVIDIA DevTech for guidance on GB300 kernel optimization, and the TensorRT-LLM team for the DWDP design and the communication and MoE kernels that this work builds on. We also appreciate the FlashInfer and vLLM communities for their open kernel implementations.
We are grateful to the LongCat IA team for cache-system engineering and production hardening, and to the Mooncake team for RDMA transfer infrastructure and support with performance and reliability. We thank SemiAnalysis and the InferenceX/AIPerf contributors for making the AgentX workloads and benchmarking tools available.
Appendix: Reproducibility
See the Kimi K3 AgentX reproduction folder on repro/kimi-k3-agentx for environment setup, DWDP16 + DEP16 serving scripts, and AgentX benchmark instructions. The feature changes used for these results are being ported back to main.